Welcome to this special lecture where we are joined by Andi Grabner, who has been working in the Software Observability space for more than 20 years. Andi will be talking about making things Observable - and - Observing the right stuff. Andi is also a CNCF (Cloud Native Computing Foundation) Ambassador and will talk about what this really means.
This is one of the lectures, where your team can optionally decide if you will implement any of the learnings into your product. Please make sure that you do the homework of meditating on whether your team can currently measure all those metrics that matter, and prepare at least one example of what you'd like to see but currently cannot.
Last Updated: 2024-06-07
Why
Measure what matters
What you measure is what you ll find
What
We will cover the following topics:
- Filter Effect
- Definition of success
- SLA, SLO
- CodeSpaces
- Leverage Ratio
- Pull based deployment
What you'll build today
By the end of today's lecture, you should have
- ✅ Argo-demo in Github codespace
- ✅ at least one metric to judge your "product" by
Homework (Flipped Classroom)
How should I prepare
- You collected your inventory of build/deploy/runtime artefacts and have an overview
- You have meditated on whether you can easily see/measure the metrics that you defined are important for determining the goodness of your product
- Your Helm Chartv0.05 is deployable to your choice of Kubernetes
- You have robust automation to deploy it
- Your team's Kubernetes is up and running
PreRead
- What is OpenTelemetry: https://opentelemetry.io/
- What are SLOs? https://www.dynatrace.com/news/blog/what-are-slos/
- What are DORA Metrics? https://www.dynatrace.com/knowledge-base/doras-four-keys/
What you'll need
- A browser (this lab was only tested on Chrome)
- A laptop with internet
- Pen and Paper
On Jun 27, 2024, you will be pitching your "product" in front of the audience, practise is on Friday Jun 21, 2024
Part | ||
Pitch | 10 min |
|
Q&A | 5 min | Answer the Audience's questions |
Lessons Learnt | 10 min | As a team, think about what you learnt and what you would do differently. In order to make the presentation flow well: please group some experiences that you all had, and then individually share some personal insight(s)
|
5 min | Buffer |
Make it yours :)
Today, we are lucky to have a guest joining us from Linz : Andi Grabner - one of the nicest people in the CNCF 🙂
We have come almost to the end of this lecture-series and it's time to ask what success really means.
Remember what you wrote down on that paper in the first class: ‘why' are you here?
In this lecture, we will talk about proving (or disproving) those hypotheses we make - especially at the outset of ideas.
In Lecture 5, we talked about value
But: How do you measure success?
"What gets measured gets done"
Attributed to Peter Drucker

https://www.splunk.com/en_us/blog/learn/noc-network-operations-center.html
We spoke about a NOC (Network Operations Center) and SOC (Security Operations Center) last week specifically to detect breaches.
What alert did you configure in Neuvector that would be worth waking up in the middle of the night to fix it?
Why did you choose it?
Looking at the bigger picture... over to you Andi
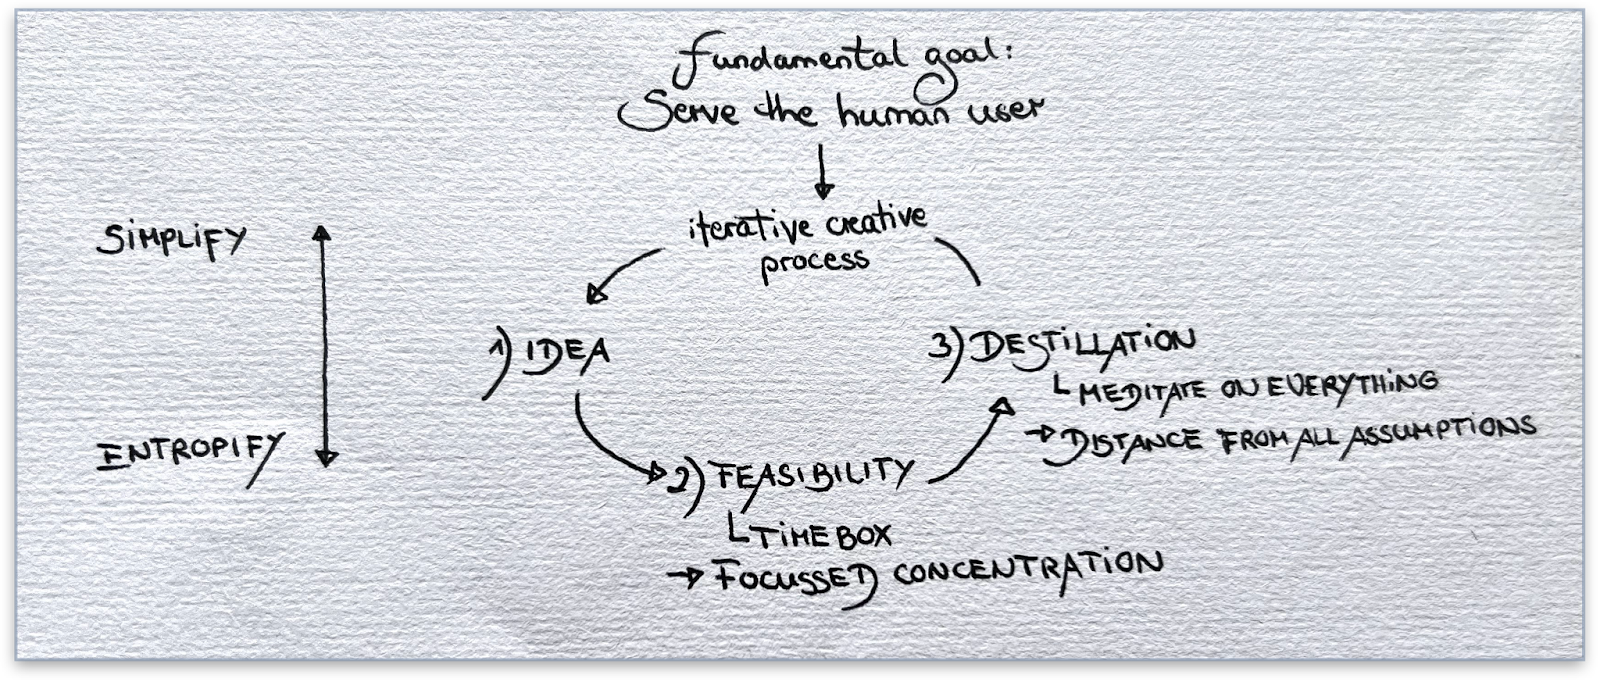
Observability is more than looking at CPU, Memory, Network Connectivity or Security Incidents. Observability should always start from the outside in!
The real questions you need to ask yourself is
- What do your end users expect from the system you offer to them?
- What does your system need to deliver in order for your business to be successful?
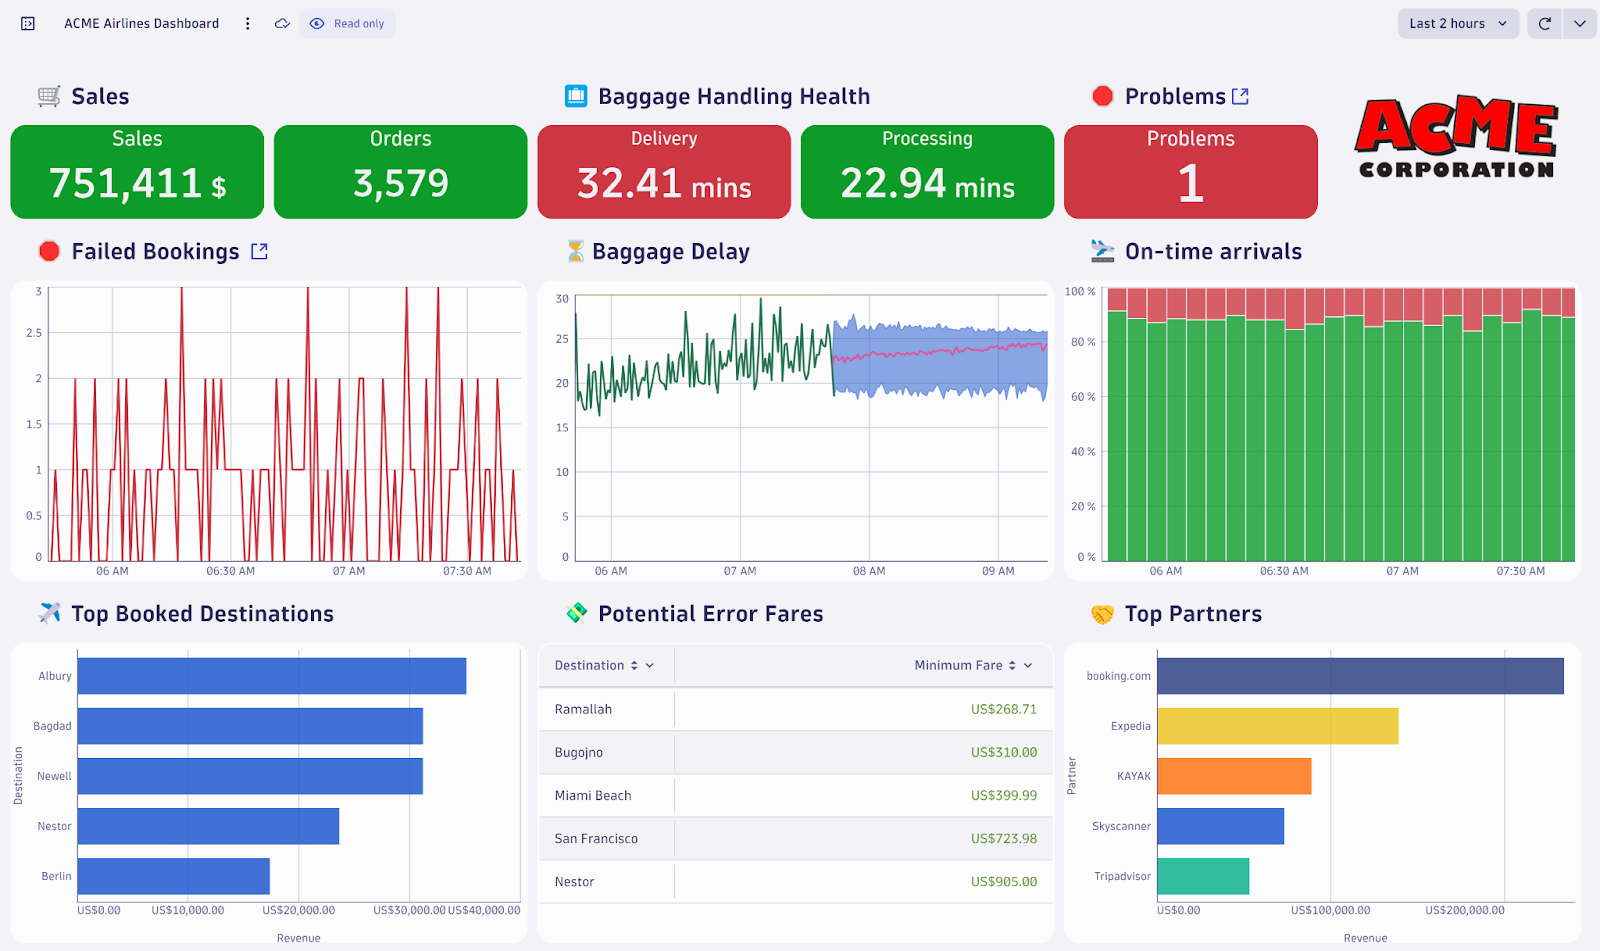
Some systems are really simple - some systems are extremely complex. Lots of things can happen end-2-end when we "click on a button on an app" like shown here!
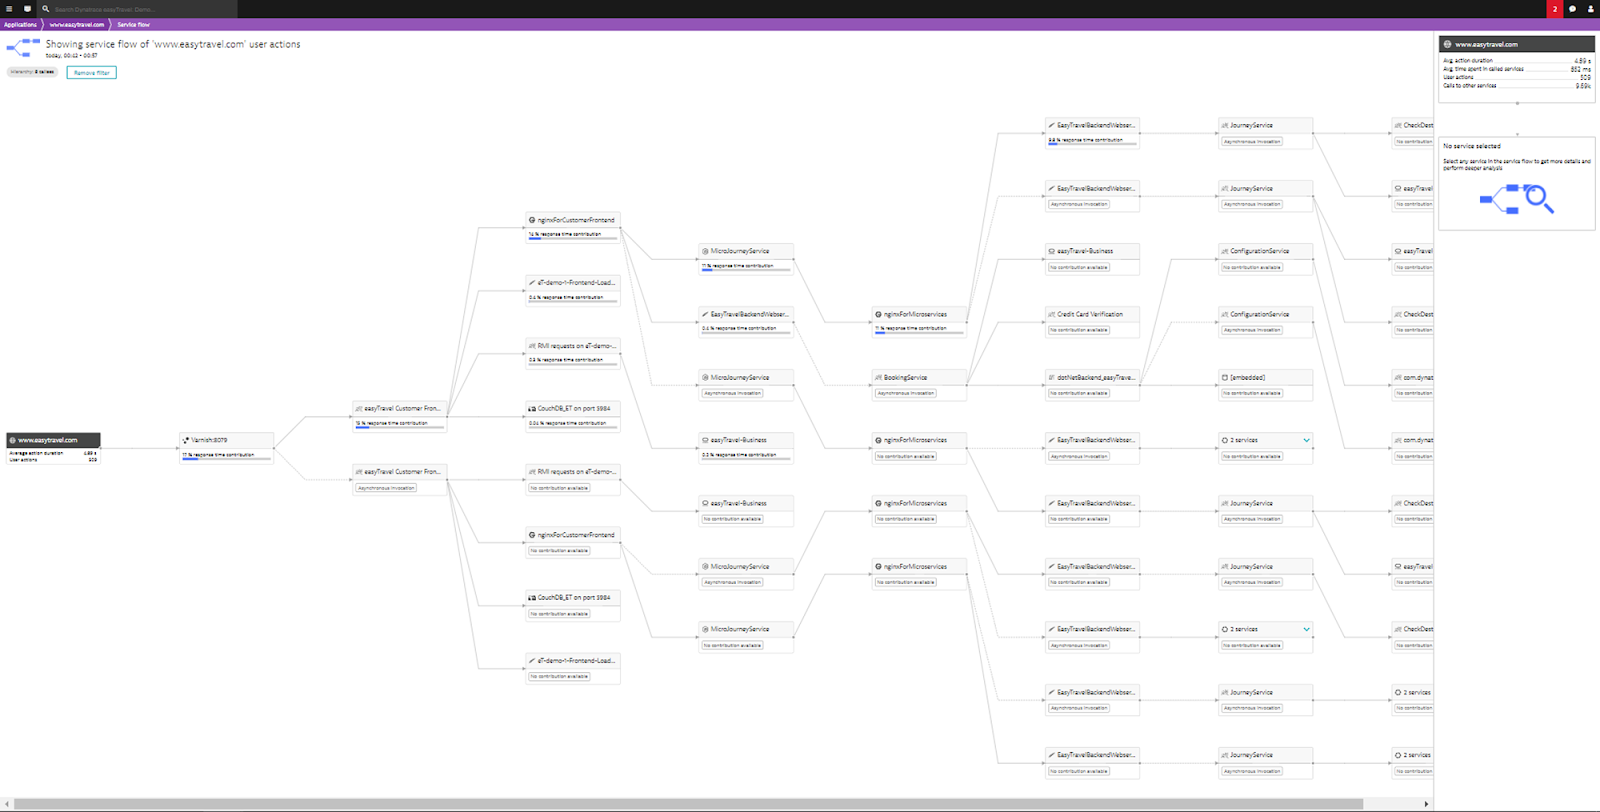
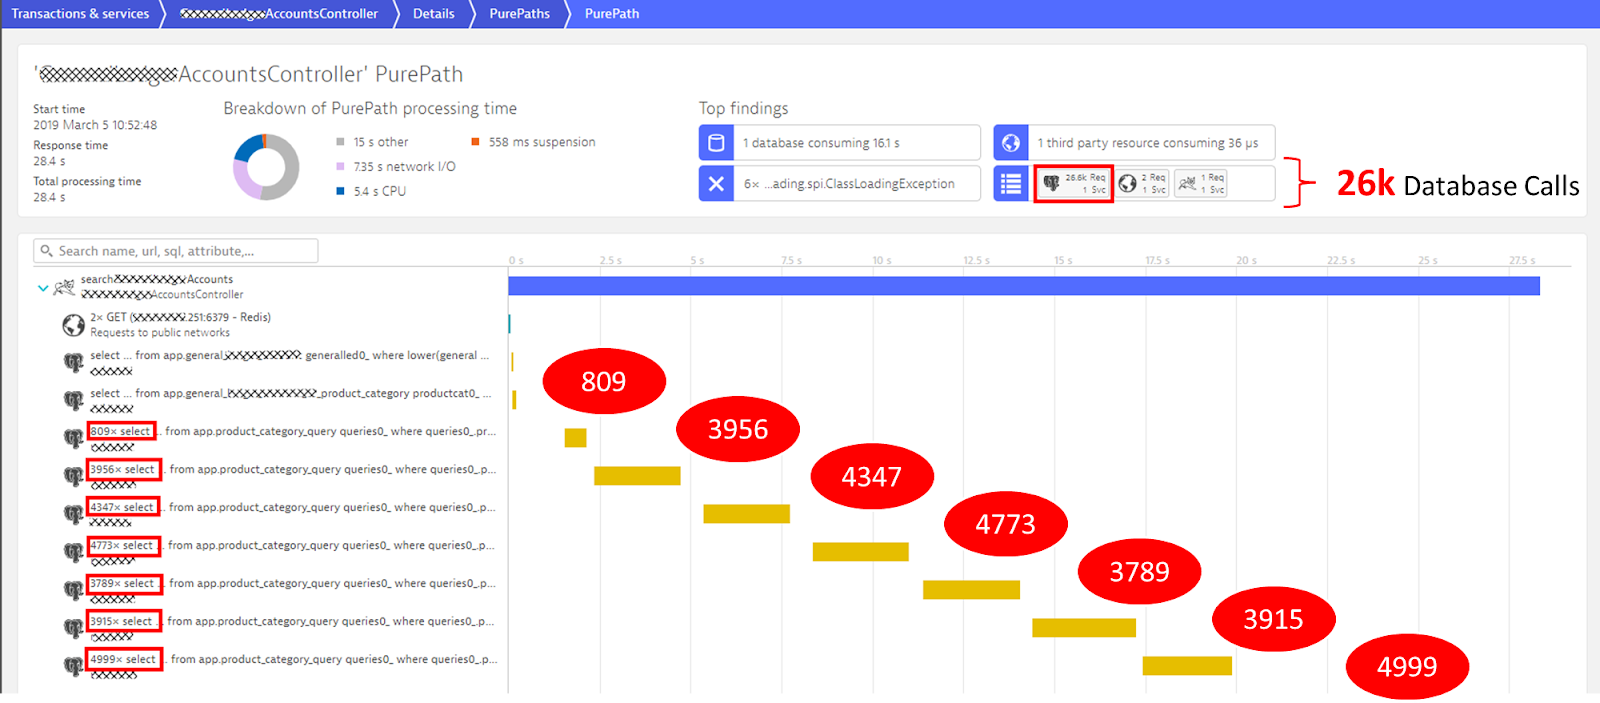
And many things can go wrong here. Not just from an infrastructure perspective, e.g: a host is down or a network connection is slow. A lot of things can also go wrong in the algorithms leading to a lot of problems:
Andi will show and discuss a couple of more things around:
- What can we use to measure success ⇒ SLAs & SLOs
- Some additional real life examples from organizations he worked with
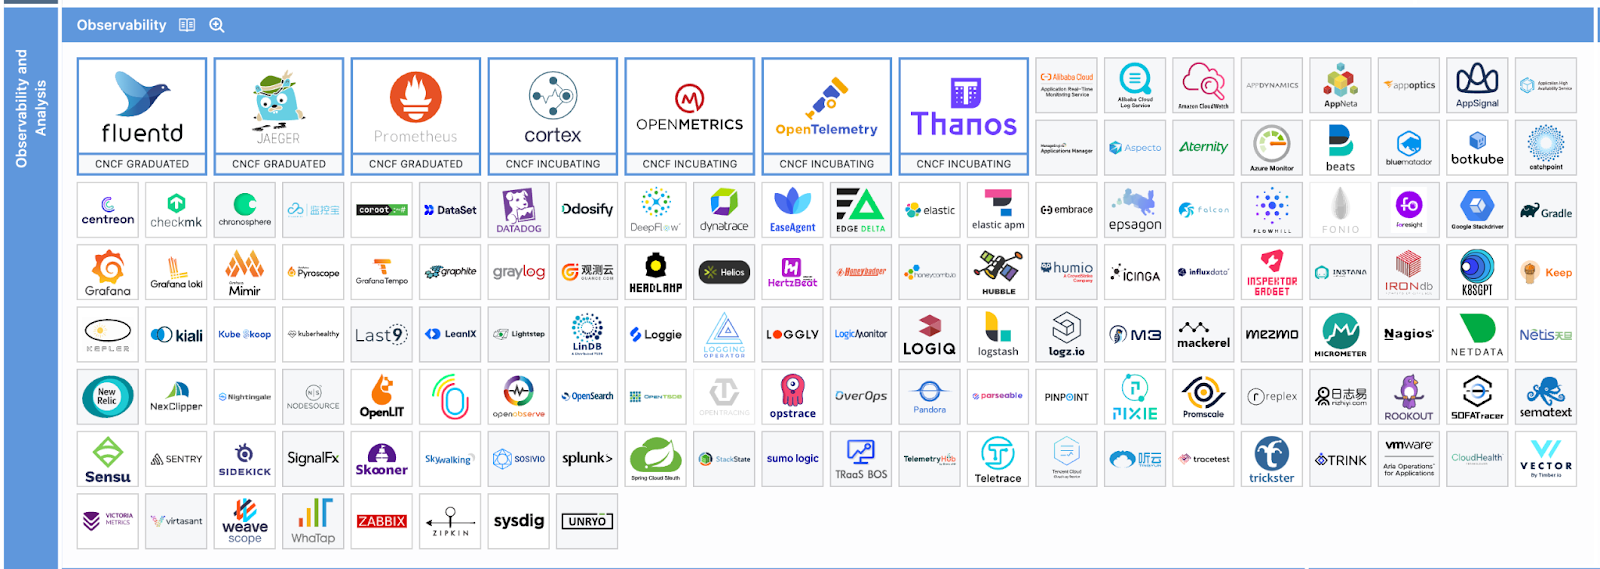
Lets see what projects are out there and how they differ
What types of solutions are there for making things observable
You probably remember Hubble from Lecture 9, the network observability tool that uses eBPF to extract the L3, 4 and 7 traffic.
It worked out of the box, because network (protocols) are very well known and can be traced out in the Kernel without having to know application details. So, this is nifty, cause you don't need to change your deployment or your application to get a nice visualization.
Here is a visualization that shows the complete path from all the different signals via the collection options via data pipelines to the backend storage which then feeds into analytics!
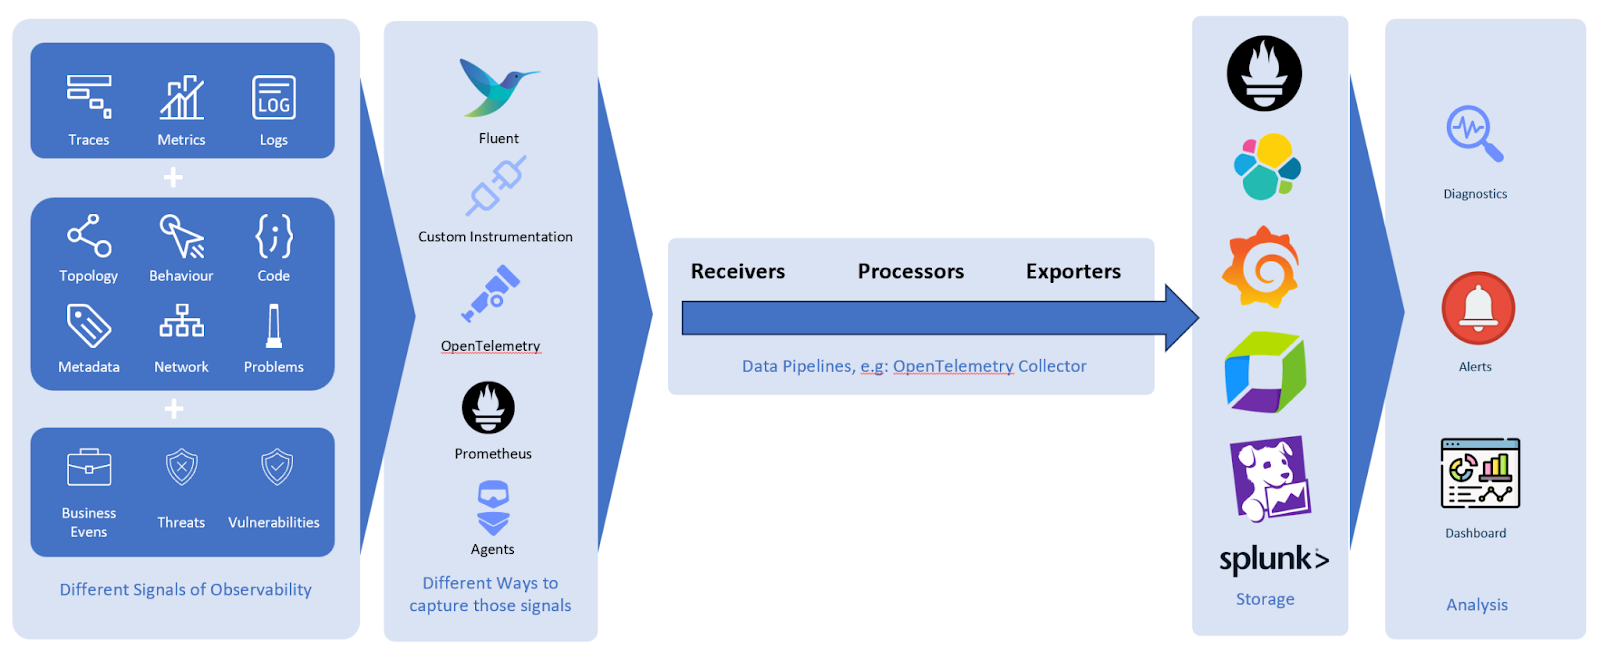
In general we can group the tools/projects into:
- Databases
- Forwarders/Collectors
- Data-extractors
- Visualization
A key question to ask is whether you want to export/ship your data to a SaaS provider, who handles everything for you want to keep the data local.
Sometimes, the exact same software comes as open-source, but also has a managed offering.
Another question is, whether you are inspecting things at runtime or you are interested in building history over time and preserving the data. Also to later analyze it enriched with context from other observability tools.
Before shipping your data outside your environment, please make sure it doesn't not contain data that are protected. Or that you are fully aware of what is in your data.
But to answer the question of what to choose: you need to first formulate what you are interested in seeing.
Ask Andi questions
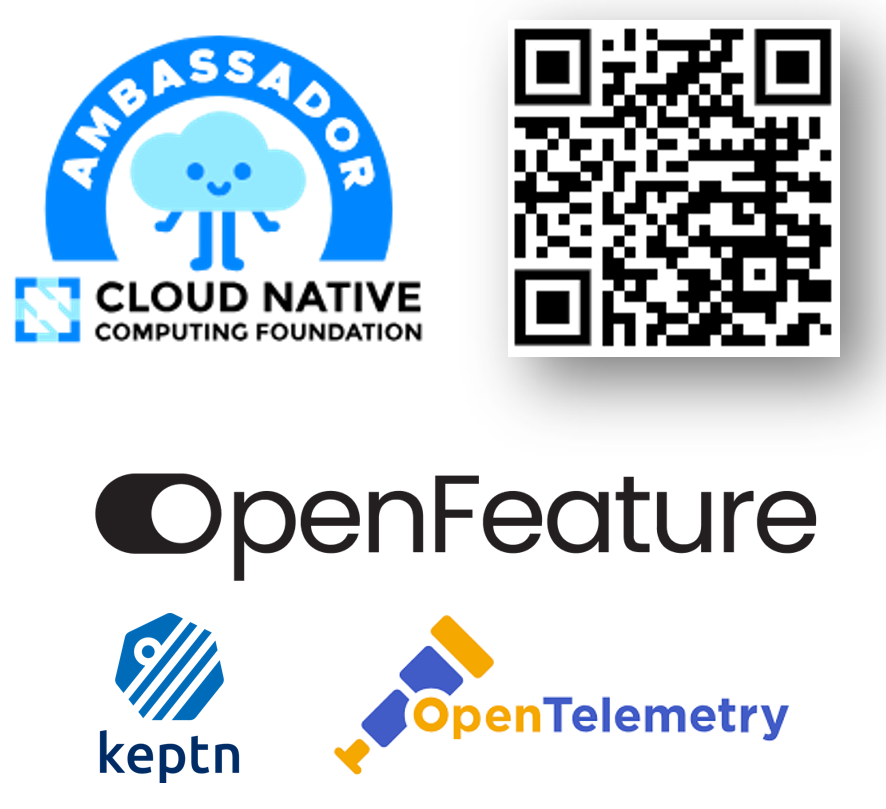
CNCF - Its all about a diverse, global community: Educating the next generation of cloud native engineers that make a positive impact
A couple of projects that you should be familiar with
- OpenTelemetry
- Prometheus
- OpenFeature
- Keptn
- ArgoCD
We will deploy a fully functional app with Argo, observed with OpenTelemetry
Based on https://github.com/grabnerandi/argocd-keptn-demo
Here are the steps
1: Fork that GitHub Repository in your own GitHub account
2: Create the CodeSpace ⇒ will take about 5-10 minutes
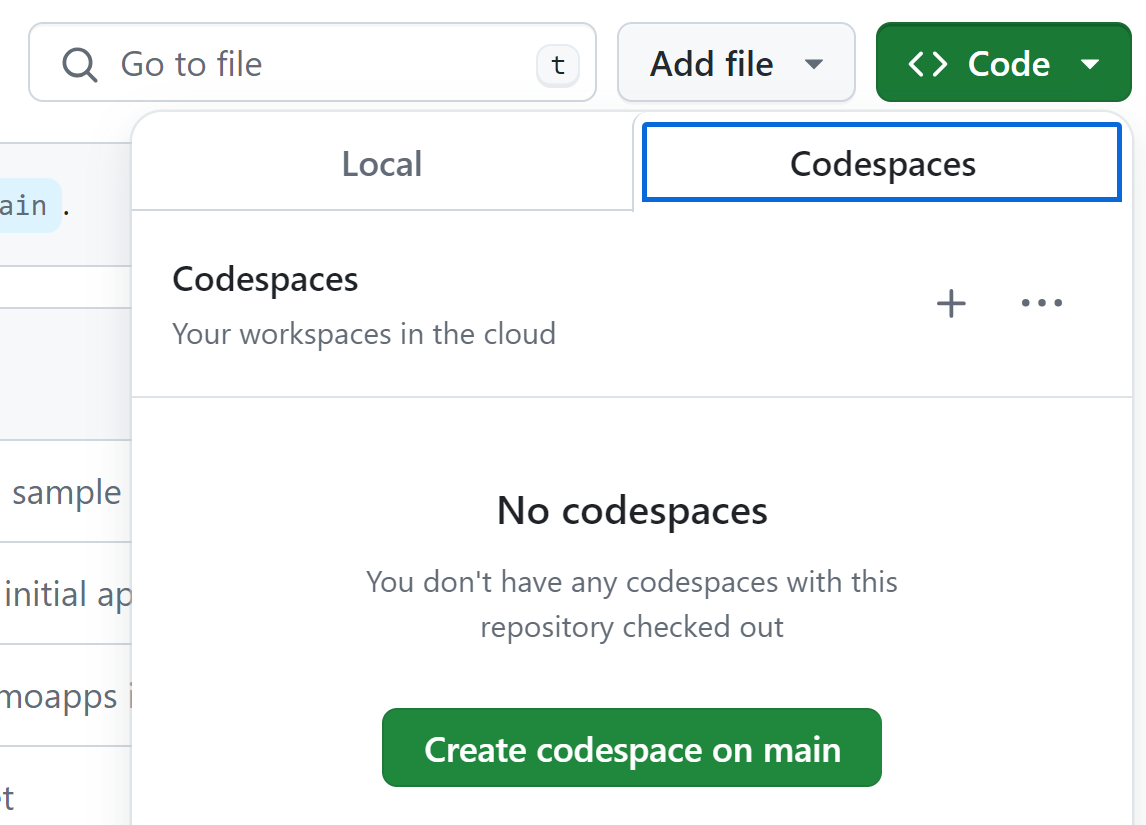
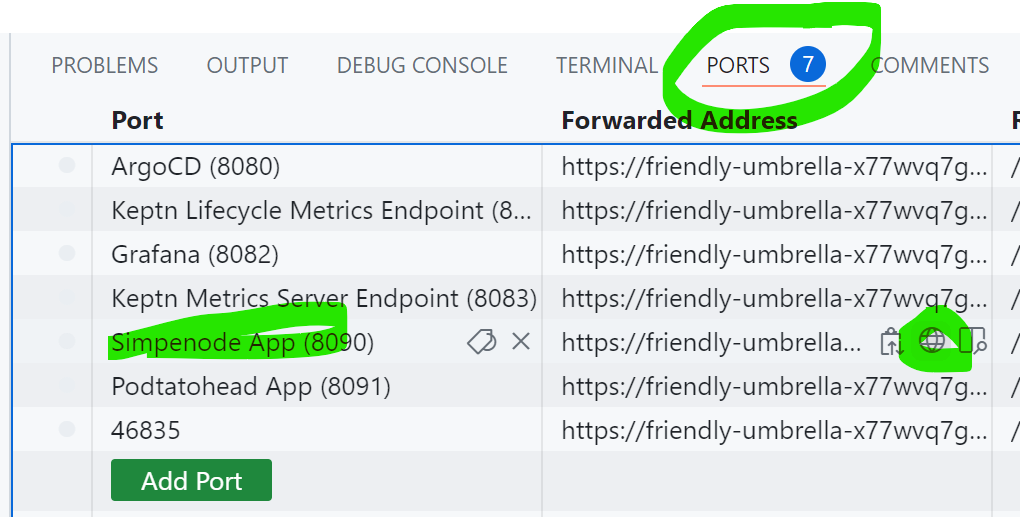
3: Open the ArgoCD link from the exposed Ports
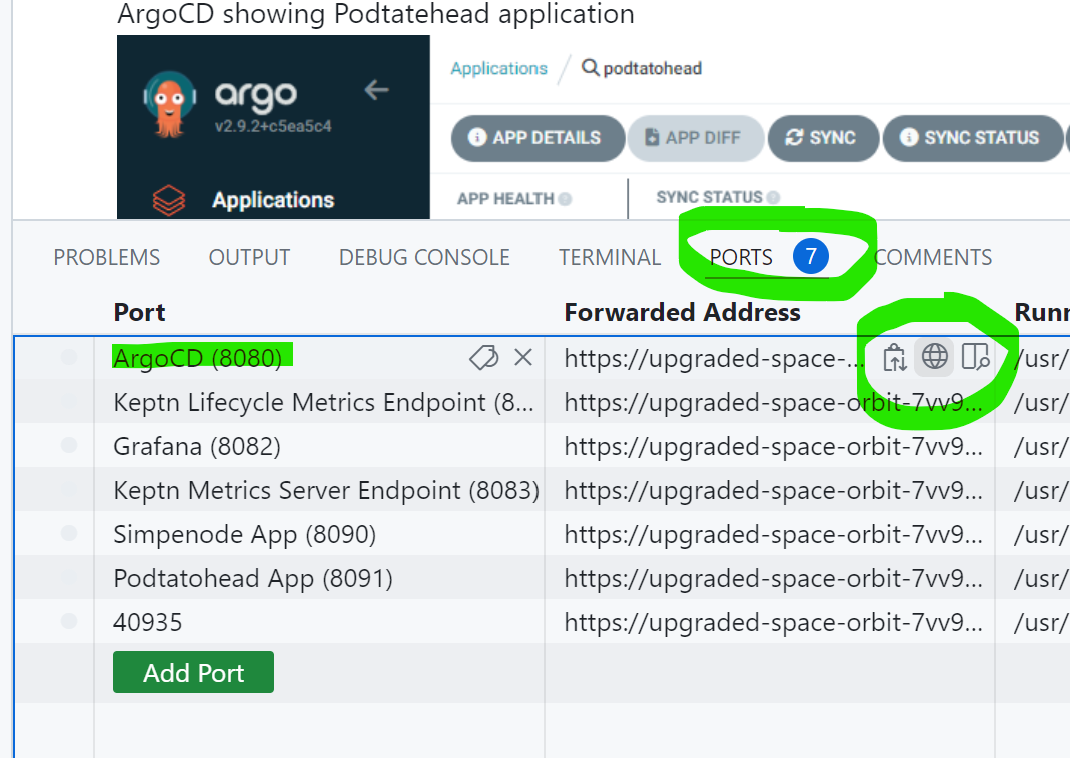
4: Login to ArgocD with admin / admin
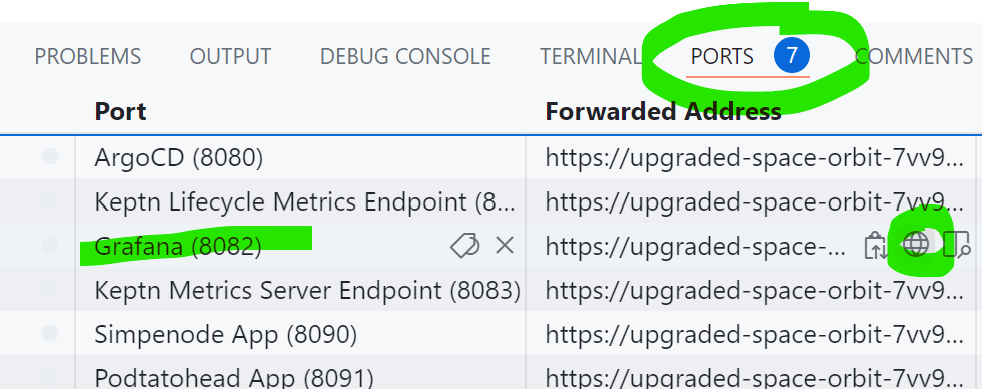
5: Access Grafana - login with admin / admin - then define a new password
6: Lets deploy our simplenode app. In the Terminal in CodeSpaces
kubectl apply -f simplenodeapp.yaml
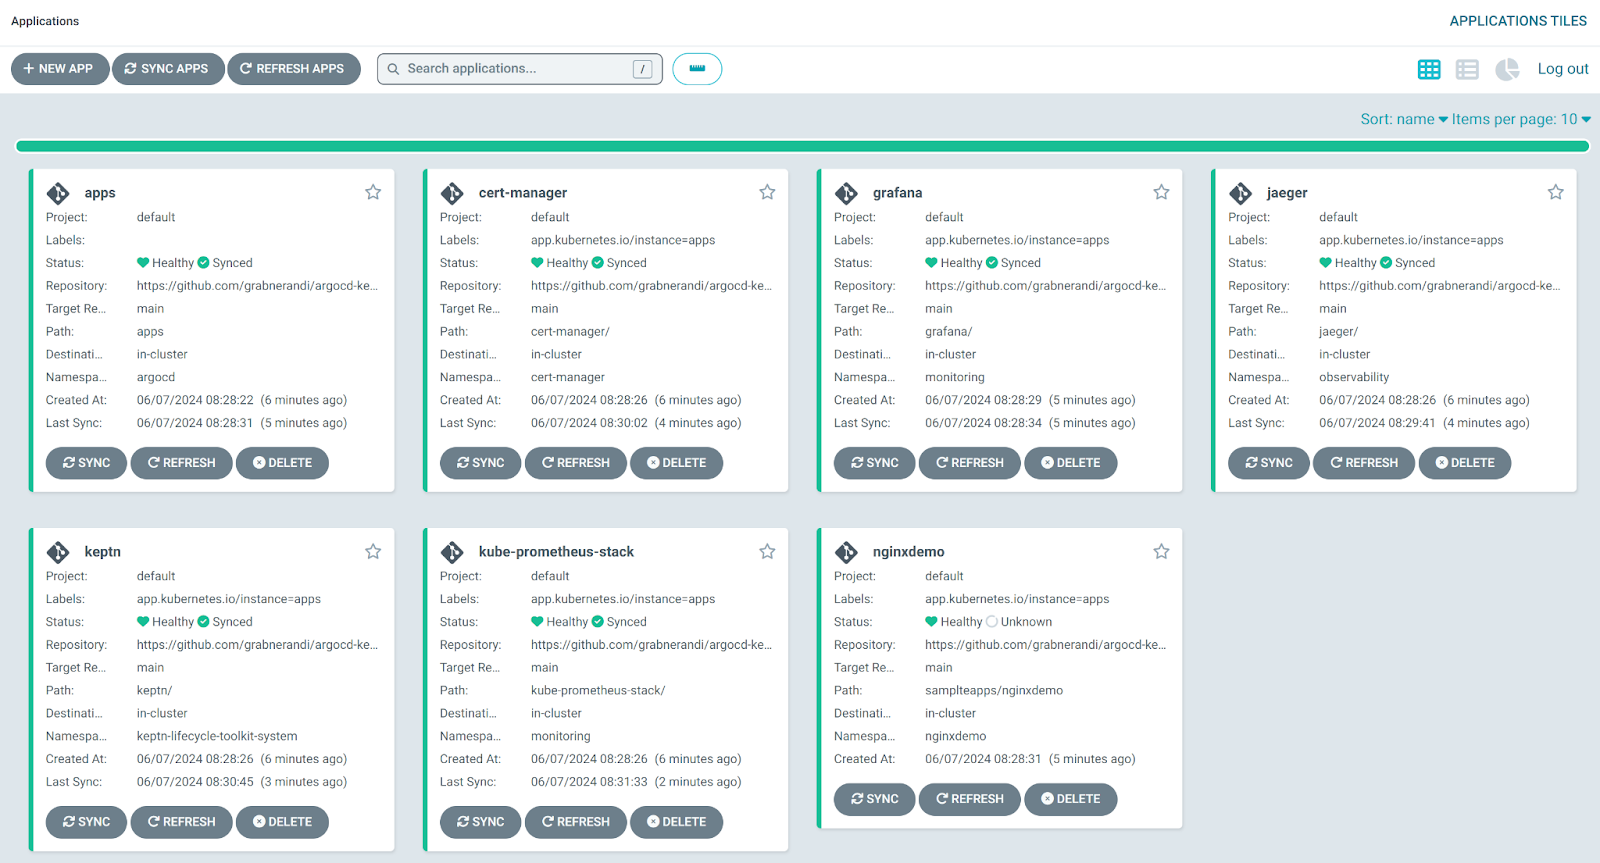
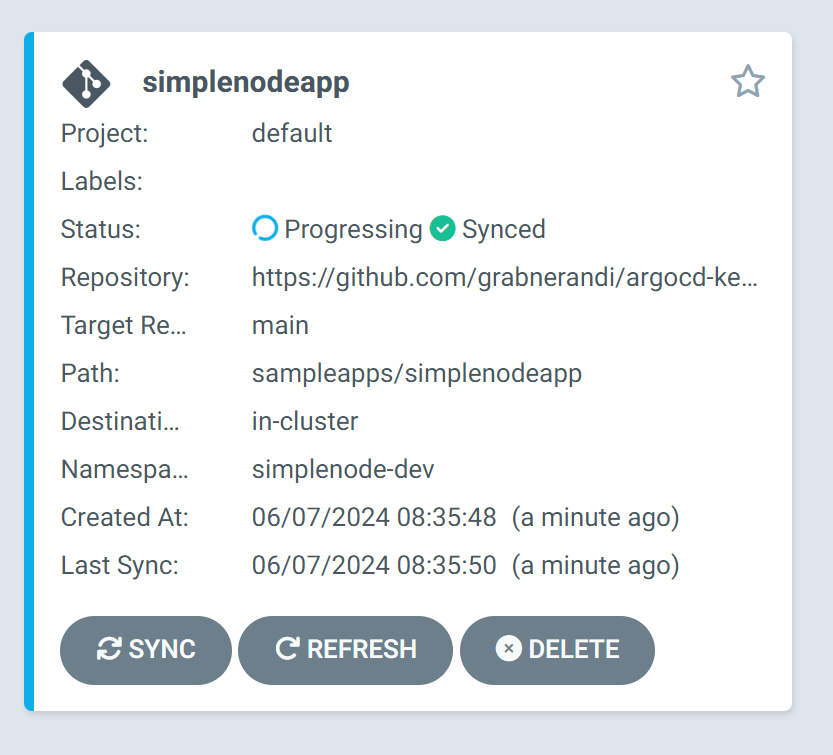
7: In ArgoCD we will see our new App being deployed
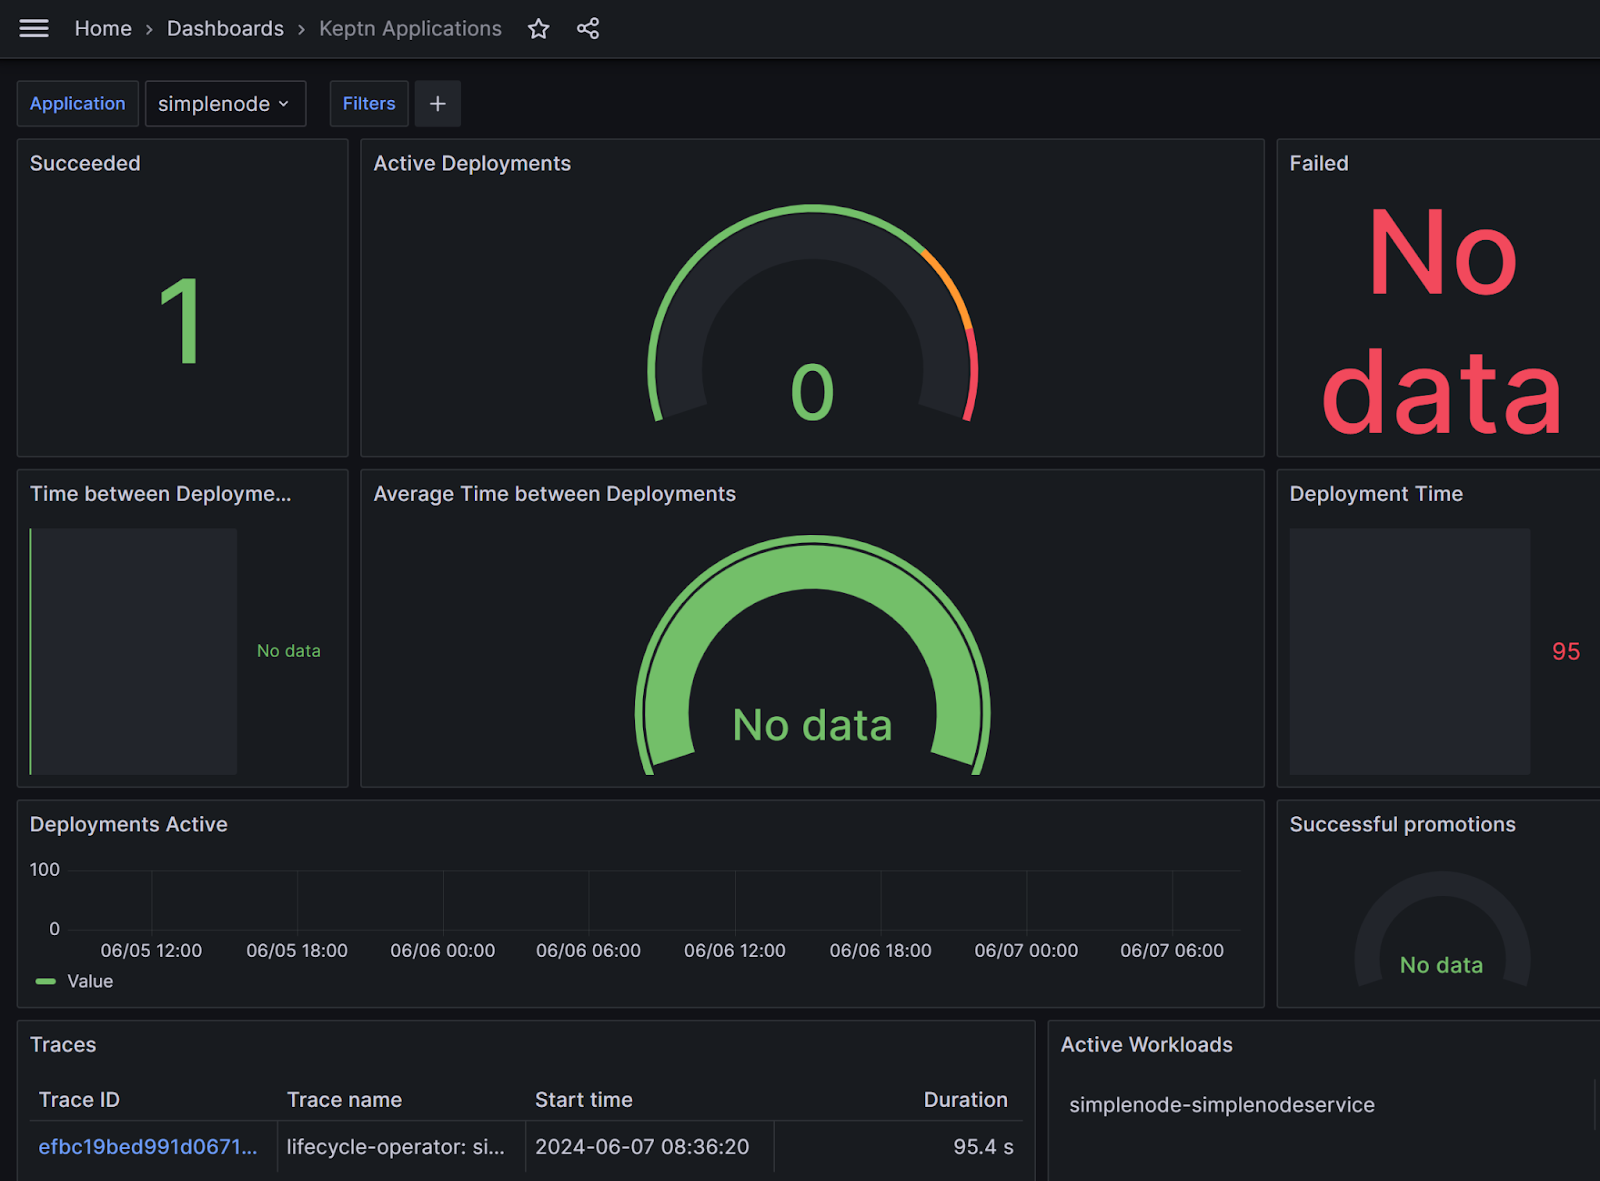
8: Explore the Keptn Workload Grafana dashboard - insights into our deployments
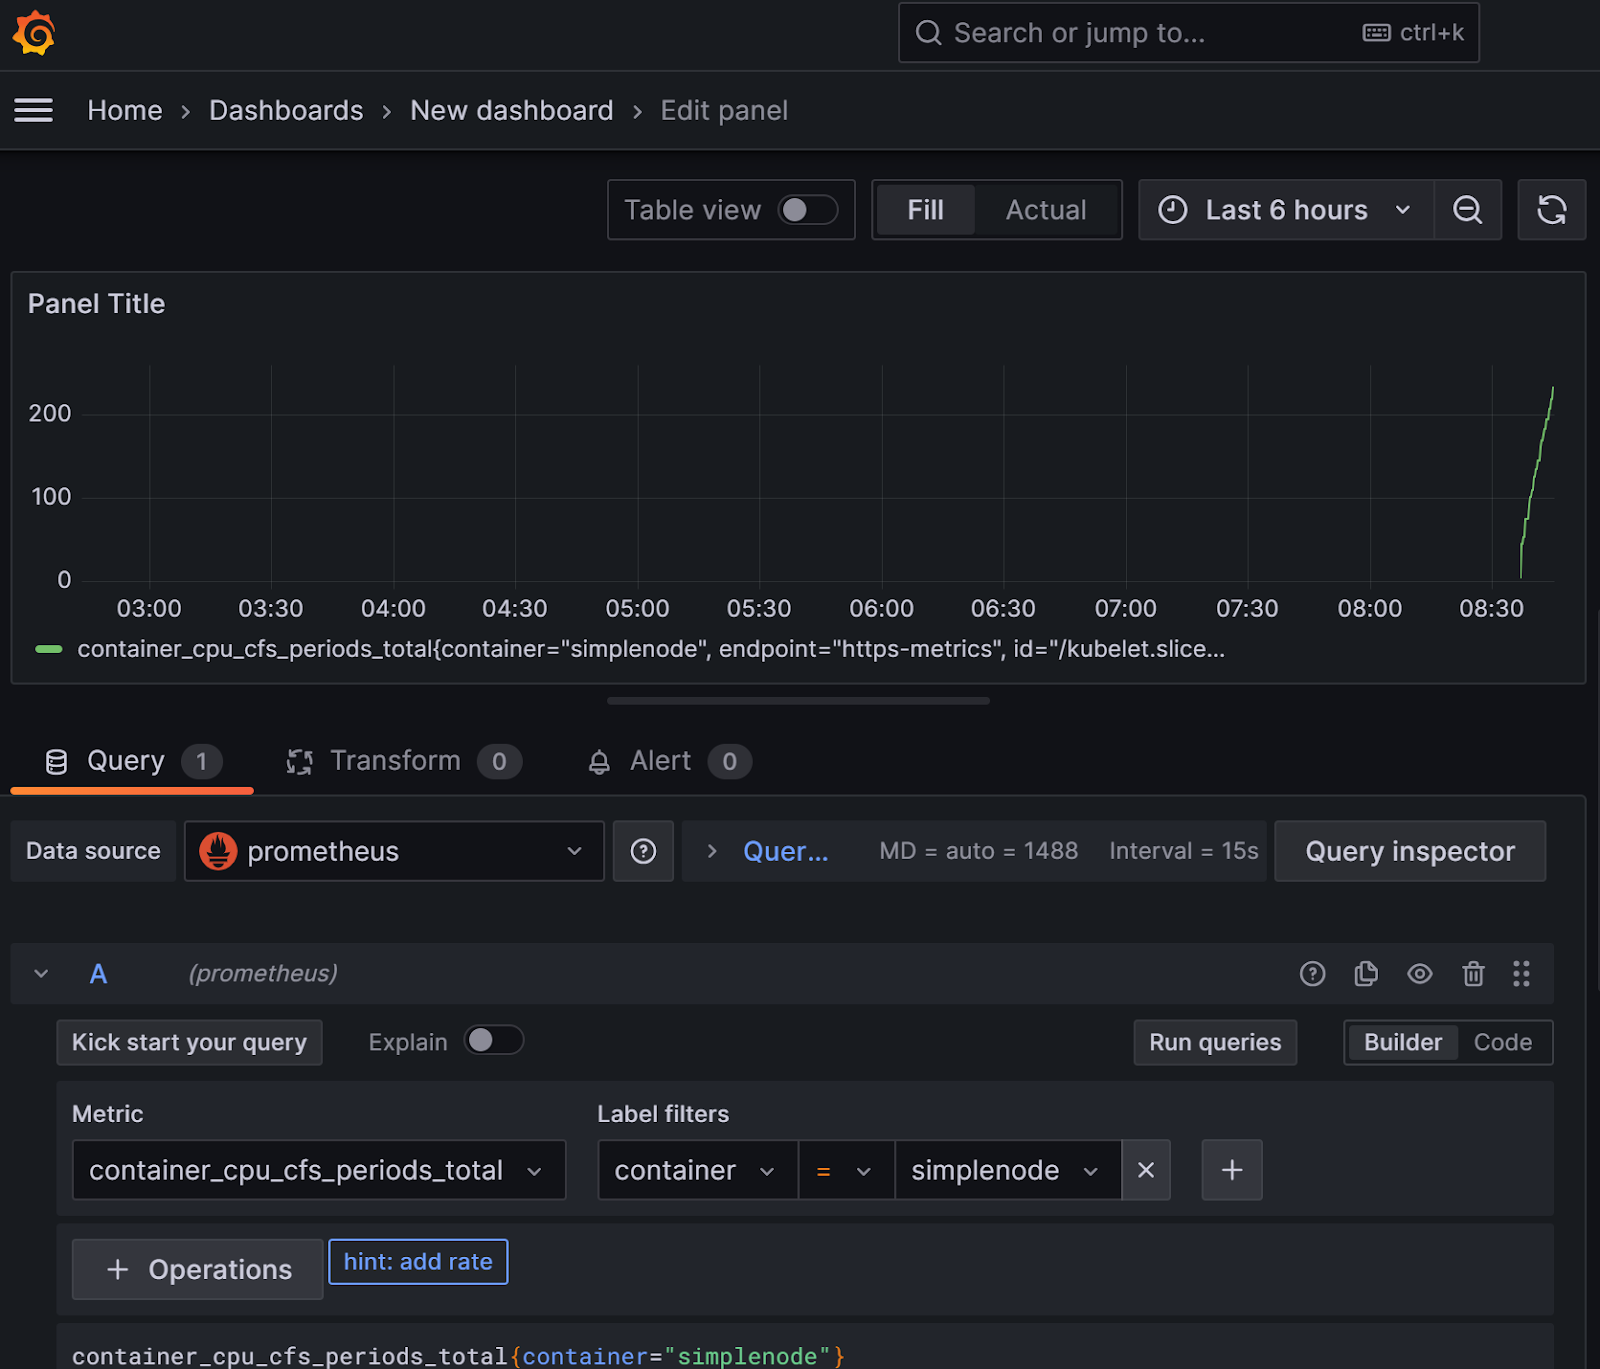
9: Create a new Dashboard to observe CPU from our simplenode app
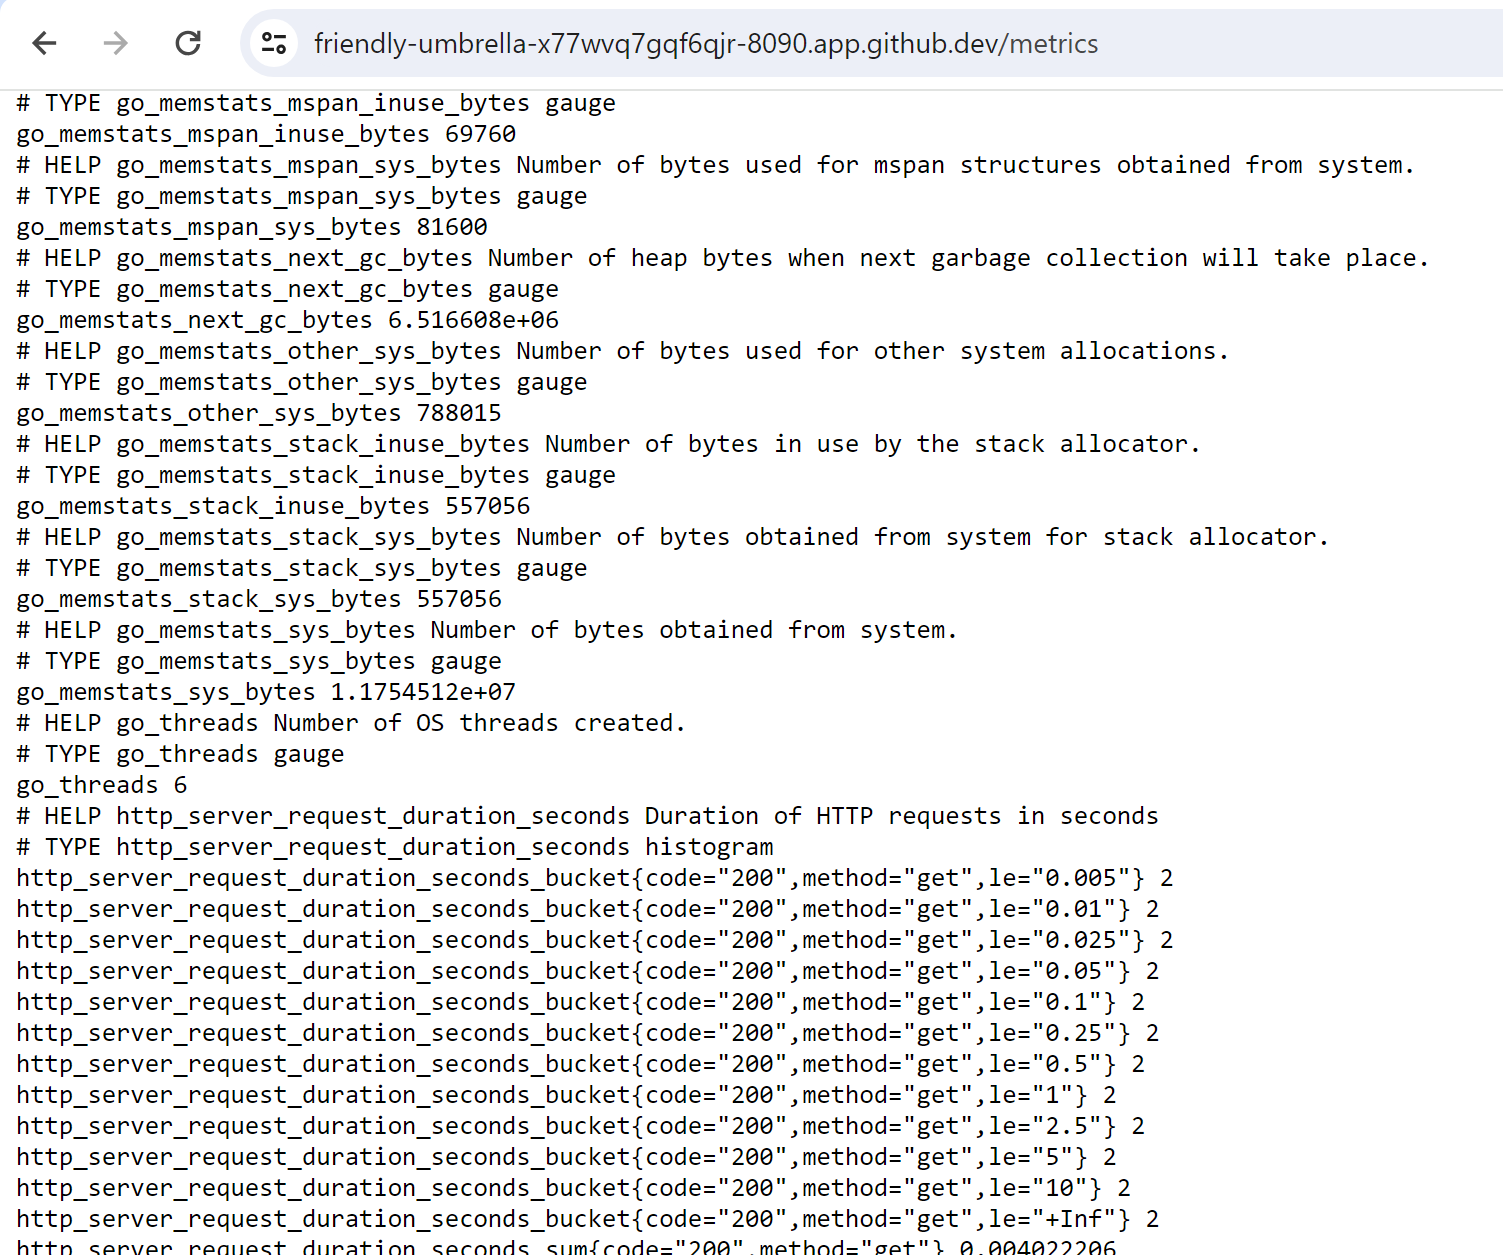
10: Lets explore how the metrics are exposed from our app
Open the App in the browser and add /metrics to the URL
Part 2: Deploy your helm chart with Argo
Now over to you...
If you have your own application as a helm chart or in a folder on a public Git repository you can create an Argo App (via the ArgoCD UI) or via an Argo Application CRD similar to the one below. Simply create a new file and call it e.g: myapp.yaml
apiVersion: argoproj.io/v1alpha1
kind: Application
metadata:
  name: YOURAPPNAME, e.g: teama-myapp
  namespace: argocd
spec:
  destination:
    namespace: YOURNAMESPACE, e.g: teama-dev
    name: in-cluster
  project: default
  source:
    path: yourpath/in/your/repo
    repoURL: https://github.com/youruser/yourrepo.git
    targetRevision: main
  syncPolicy:
    automated:
      prune: true
      selfHeal: true
Once you have this configured in the Terminal window execute this
kubectl apply -f myapp.yaml
The pitch is about the value of your product, however we have some minimal criteria the application/deployment should fulfill on that day. This does NOT mean that you need to show all of these things in your pitch.
Review that your product meets all of the tick boxes
Make it work, somehow ...
List here:
By the end of the semester, your startup (team) will have a running service that includes the following deliverables:
- ✅ a value proposition
- ✅ a target audience
- ✅ a 60 seconds TL;DR what your startup does and why anyone should care (in the main Readme)
- ✅ one released artifact
- ✅ one Dockerfile (or equivalent recipe)
- ✅ one meaningful (unit or integration) CI test
- ✅ no critical vulnerabilities
- ✅ one repo with your team
- ✅ a license
- ✅ at least three decision records (e.g. ADRs)
- ✅ a versioning scheme (how do you increment versions)
- ✅ a CD pipeline that can be triggered manually
- ✅ a package (e.g. a Helm Chart)
- ✅ a Readme that explains how to use it
Congratulations, you've successfully completed this training on observability