Welcome to the seventh lecture, where today we will understand how to deploy a managed K8s as well as manually deploying your startup app as a package.
Last Updated: 2024-1-11
Why should I care about package managers?
Because you very likely don't want to write and maintain thousands of lines of yaml
What you'll build today
By the end of today's lecture, you should have
- ✅ an AKS deployed using Terraform
- ✅ use CD automation to deploy some of the famous helm charts (e.g. prometheus)
- ✅ a simple helm package for your app and deploy it from local command-line
Homework (Flipped Classroom)
Prepare
- Your manifests deploy on kind and work there, you understand the settings
- We will be working on deploying AKS into your branch on Azure, so if you have tons of stuff in there: you can either delete that for now OR you form small groups with at least one person that has no infrastructure in their HandsOnCloudNative/iac/*.tf deployed
PreRead
What you'll need
- TBD
- The usual (git, slack, MFA app, laptop with internet, github account etc)
In the beginning, there was <a story>
Helm is a package manager for Kubernetes. It was created to simplify the deployment and management of applications on Kubernetes clusters.
The history of Helm dates back to 2015 when it was initially developed by the team at Deis, a cloud computing company. It was later donated to the Cloud Native Computing Foundation (CNCF) and became an official CNCF project in 2017.
Helm provides a way to define, install, and upgrade complex Kubernetes applications using a simple and declarative approach. It uses a packaging format called "charts," which are collections of YAML files that describe the resources and configurations required to deploy an application. Helm charts can be versioned, shared, and reused, making it easier to distribute and manage applications across different environments.
One main point of criticism is the template language `mustard`, which can get unwieldy and can't be used in templating easily. (yes, you read that correct)
Lets see what projects are out there and how they differ
Navigating Container Landscapes
https://landscape.cncf.io/guide#app-definition-and-development--application-definition-image-build
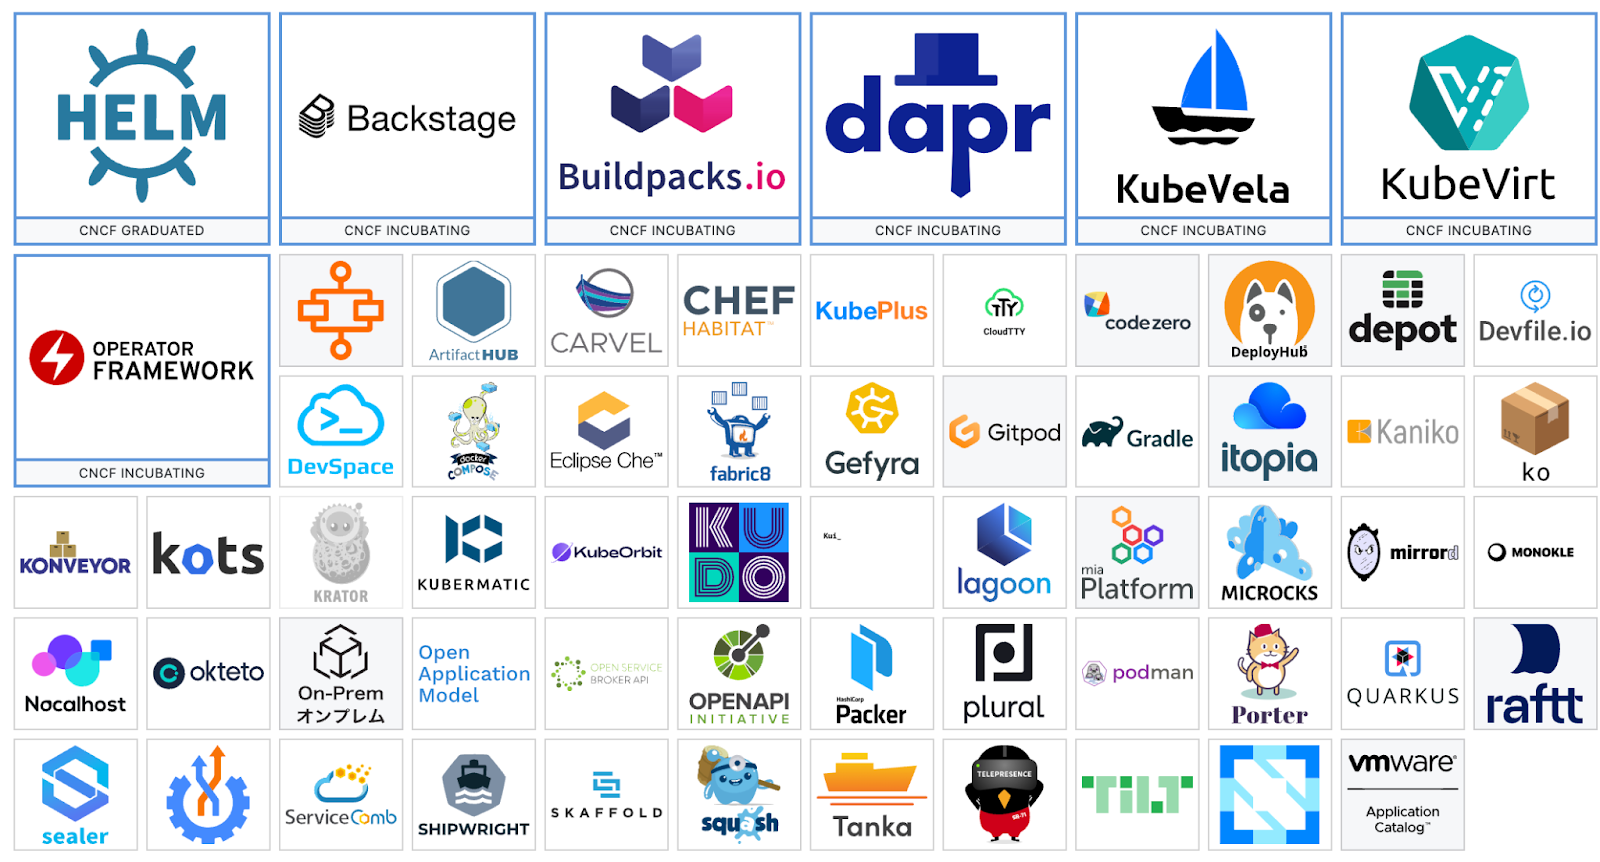
While Helm is a still the most used package manager for Kubernetes, there are a few alternatives available that avoid specific shortcomings of helm.
It has overcome its early security problems (tiller) and usage especially wrt versioning have been much improved
1. Kustomize: Kustomize is a built-in package manager in Kubernetes that allows you to customize and manage Kubernetes resources without the need for additional tools. It uses a declarative approach and overlays to apply customizations to base resource files. Kustomize is a good choice if you prefer a lightweight and native way to manage configuration and customization of Kubernetes resources.
3. Operator Framework: Operator Framework is an open-source toolkit that allows you to build, package, and manage Kubernetes-native applications called "operators." Operators are Kubernetes controllers that extend the functionality of Kubernetes by automating complex tasks and managing custom resources. Operator Framework is suitable if you need to manage and deploy applications that require custom controllers and advanced automation capabilities.
4. Argo CD: Argo CD is a declarative continuous delivery tool for Kubernetes. It provides a GitOps approach to manage and deploy applications on Kubernetes clusters. Argo CD continuously monitors a Git repository for changes and automatically deploys and syncs the applications with the desired state defined in the repository. Argo CD is a good choice if you prefer a GitOps workflow for managing Kubernetes deployments.
. Helm is a popular choice due to its wide adoption, extensive community support, and rich ecosystem of charts.
How do use the best of the managed offerings without becoming too exposed to one vendor
https://learn.microsoft.com/en-us/azure/aks/azure-cni-powered-by-cilium
To demonstrate this, we will look at three distros of k8s and look at two Terraform deployments of them (if you are really deep into IaC, you can of course also look at the Openstack deployment - it is very complex, so if this is the first time you are confronted with this topic, you might want to skip it)
Managed k8s in vendor flavours
The most obvious way to get started with a "real" k8s, you will typically go to one of the big 3 CSPs and deploy a "managed" k8s. The three distos are named AKS (Azure), EKS (aws) and GKE (Google).
The Kubernetes API itself will be the exact same if you choose the exact same version.
That's about where the similarity ends.
By "managed" , we refer to the control-plane and control-plane nodes, i.e. you as the customer do not self-manage any of the control-plane functionality. And you can instruct the CSP to auto-upgrade/patch the control-plane.
You do however manage everything else, including the VMs on which your agent-nodes are running.
What is different between CSPs underneath their offering:
Each CSP will have a totally different implementation of their network, multi-availability-zone handling, internal load-balancing and obviously which hypervisor/hardware they have in each of their datacenters.
Some features, are also only available in either certain geographical regions or certain type of subscriptions (US-Govmnt and China are often the first, that have very obvious constraints)
What is different for you:
When you now deploy (e.g. via Terraform) , you will need to answer a few question right up front:
- The location and how many availability zones
- Multi region or single region
- public or private cluster
- Which CNI (more details on that in Lecture 9)
- Will you need custom mounts or special CSI (container storage interface drivers)
- What to encrypt and if you're bringing your own keys
- ..
Ad 1 ) The multi-az distribution is typically handled for you, unless you really want to specify it yourself
Ad 2) Multi region typically incurs network costs for ingress and egress across the regions and also very likely will add latency
Ad 3) The way the access to the control-plane nodes and k8s-api is shielded can also differ, there are purely network level controls in place, but additionally it can control if ssh is absolutely forbidden, if a root certificate is ever provided , how authentication is enforced
Ad 4) We will be using Cilium in all 3 examples, however each CSP will have a default CNI . The integrated CNIs usually have limitations compared to a BYO CNI, the cloud providers need to find a compromise between general compatibility and the features of the individual CNIs. https://isovalent.com/blog/post/cilium-private-aks-cluster/
Ad 5) Mounting is in direct opposition to some security restrictions, so if you dont think this through and simply opt for maximal security, you might end up not being able to mount using certain protocols or not being able to propagate mounts . Each CSP will by default provide a storage class and a CSI for it. For vanilla apps this will be sufficient.
Ad 6) You can choose between no encryption (the default typically is managed encryption at rest) up to confidential compute nodes with your own keys. Using your own encryption implies high maintenance cost and a high level of expertise on how to deal with stolen/lost master keys!!
Auto-pilot setups
Additionally, there exists on some CSPs the option that they manage the entire cluster for you, incl auto-scaling, cost-optimization, upgrades etc etc
Some of the settings (such as policy, security, budget-alerting) is typically inherited from a higher setting, and then you have some more modular setting to choose from.
In general, the list price will be higher for a auto-pilot cluster (around factor 2) and it will be rather opinionated. You end up with something akin to a serverless k8s, since you do not manage anymore any of the VMs. You now only manage your pods and you only PAY for what your pods really consume (rather than what the VM underneath costs).
Scenarios in which an auto-pilot setup is reasonable:
- Your deployments bin-packing on a regular cluster leads to lots of node idle time
- Your pods are mostly CPU constrained and can be horizontally scaled up on demand
- You can benefit from the default hardened setup of auto-pilot , so you don't have to care about security hardening of k8s.
Scenarios in which an auto-pilot setup is NOT reasonable:
- You need advanced configuration
- You need access to the nodes
- You already have an optimal bin-packing plus auto-scaling setup
- You require version pinning
Self managed setup
Now, if you are in the position to have your own datacenter (and assuming you got electricity, cooling, fire, server-racking and all the nightmares of operating a datacenter covered)
You can run your own k8s.
Again, you have options:
- Vanilla k8s: don't do it
- OKD or RKE2 DIY
- Openshift/Rancher remote managed by <somebody>
The worst of all worlds:
Host your own Openstack (or equivalent) on a public CSP and install your own k8s on it ;) ideally with unsupported/deprecated stuff running on it
So: should I host my k8s myself?
No
Get some more Terraform practise, however you can do this exercise as a group as it will save time (you can repeat it at home if you want)
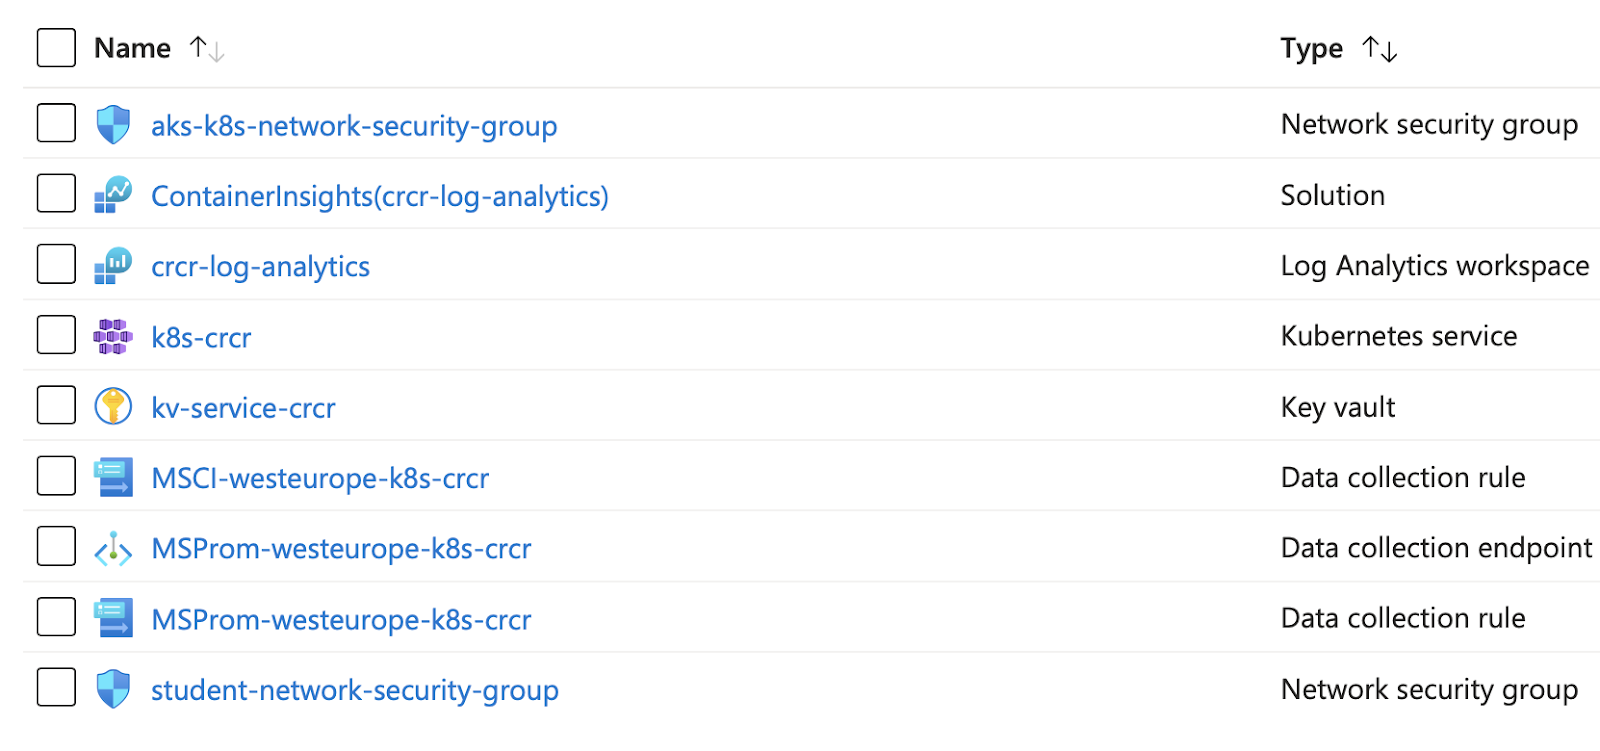
Go to our Azure DevOps repo and make sure you know what is currently deployed in your Azure resource-groups.
(If you have lots of stuff there that you dont want to delete, please group up with someone who has an empty resource group)
A normal cluster
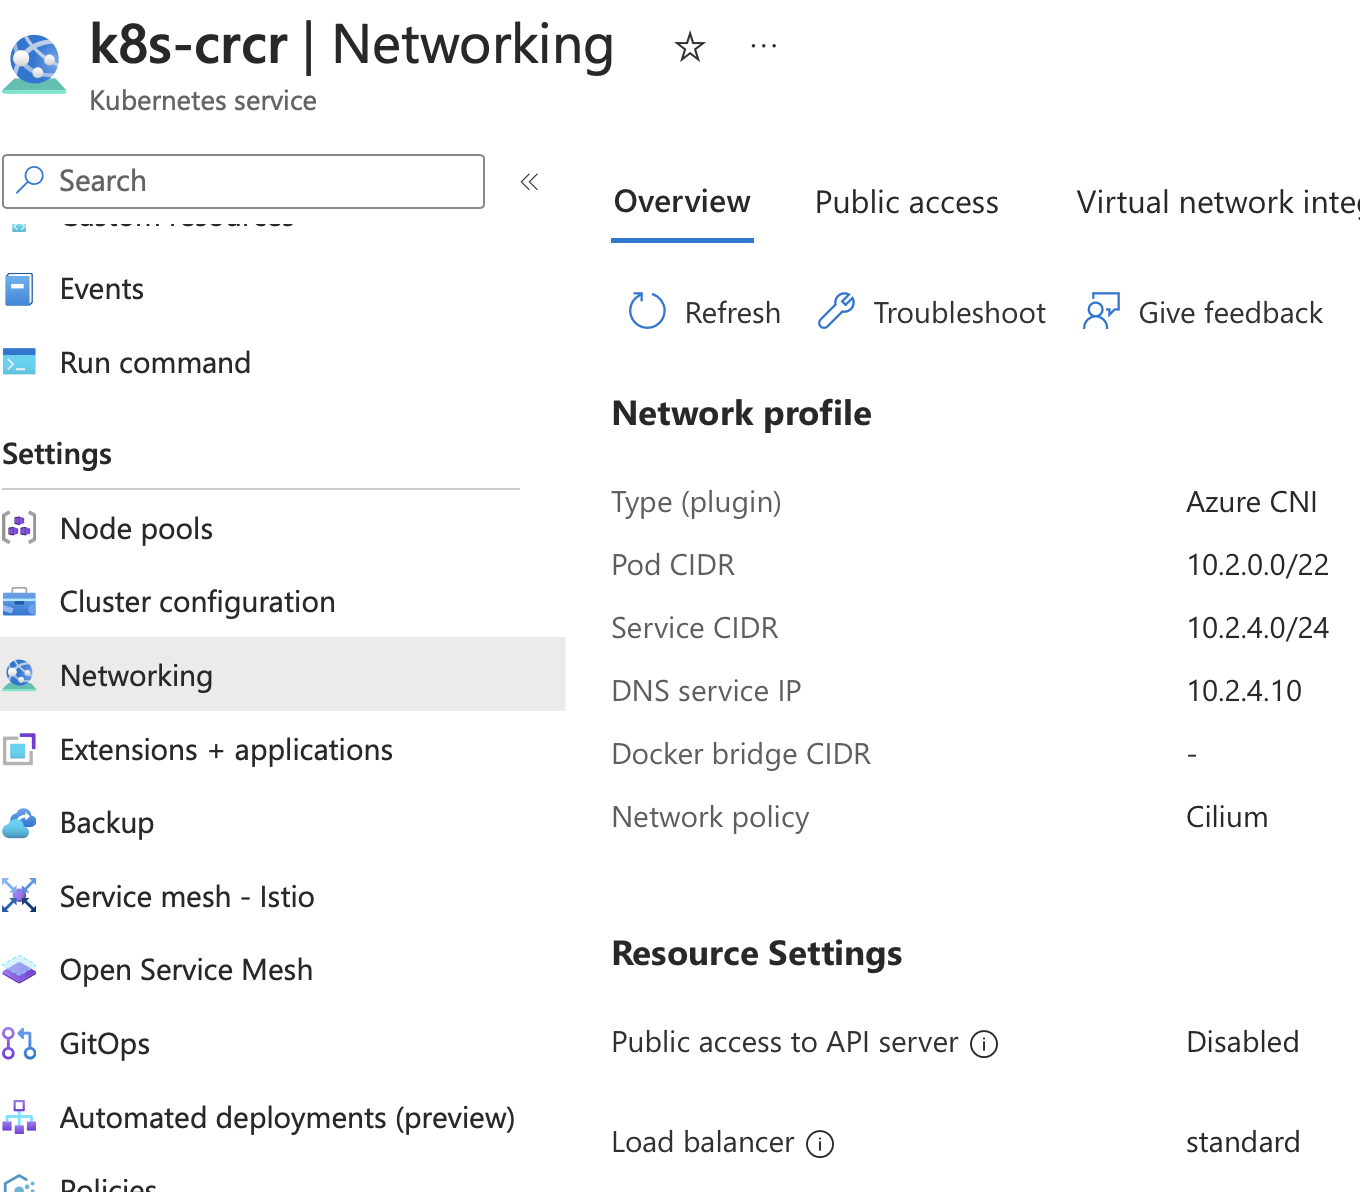
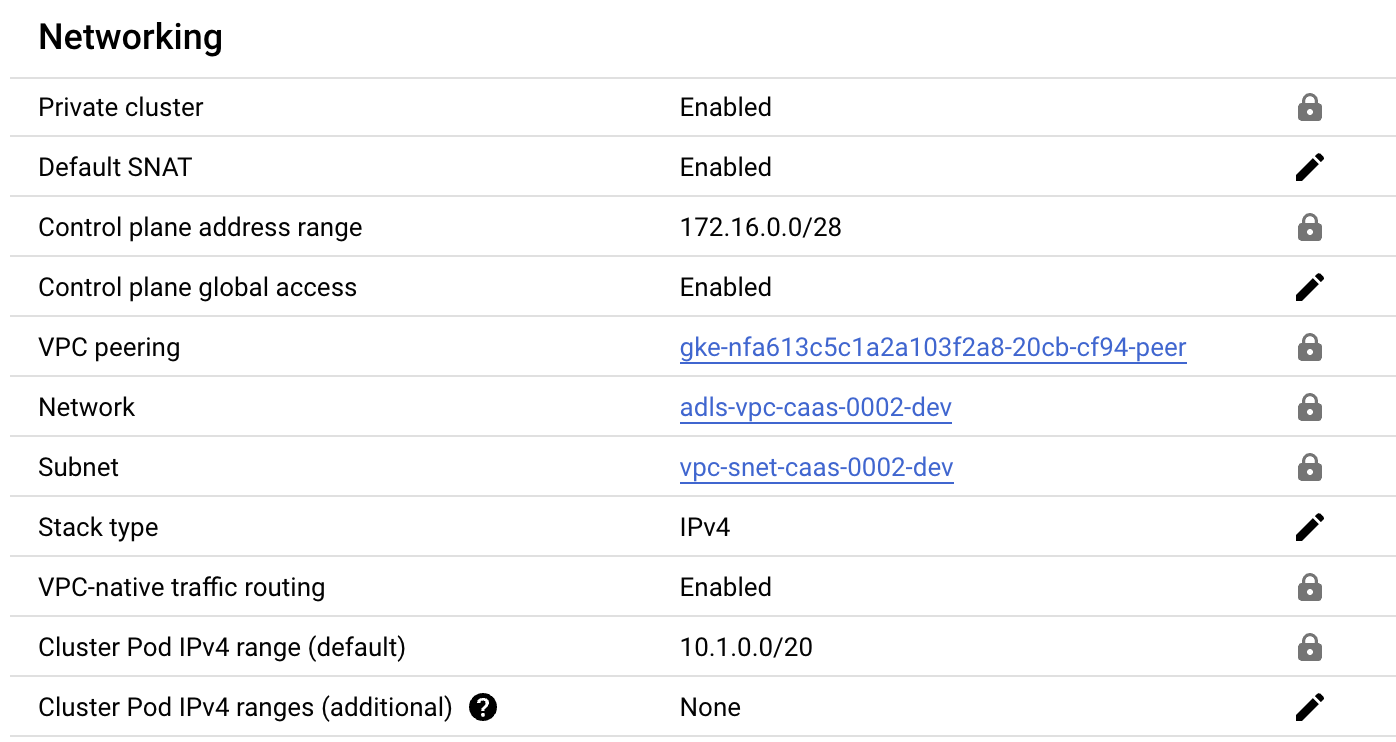
First, we deploy a cluster, as you can on pretty much any CSP.
It ll be private, use workload identity and by default will not allow access from outside (or the cloud portal).. This is pretty critical, but you need a second to compare the two (AKS and GKE) to understand that their settings are as identical as can be.
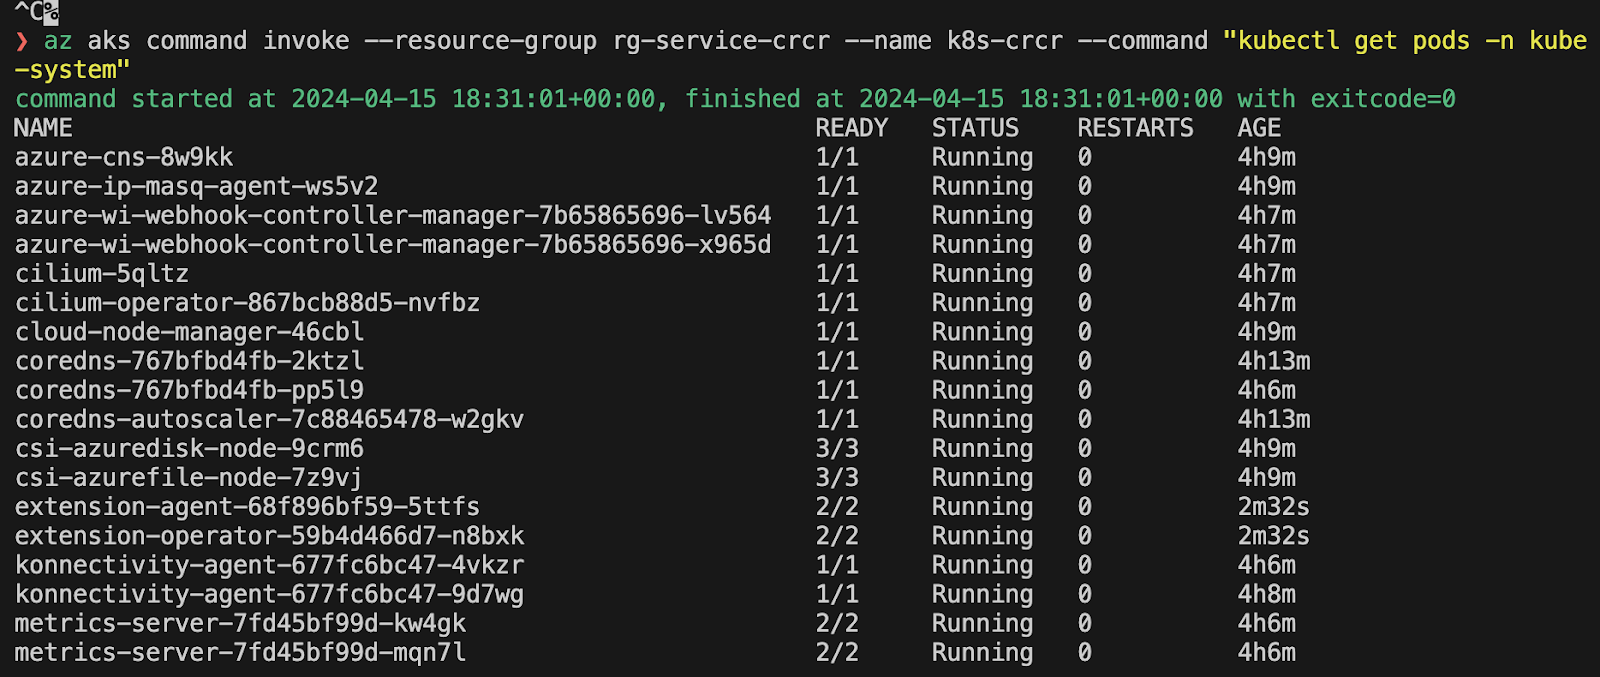
The way to work with these private clusters depends a bit on the CSP, here for AKS, we can remote invoke the kubectl commands and you might wanna set an alias in your shell.
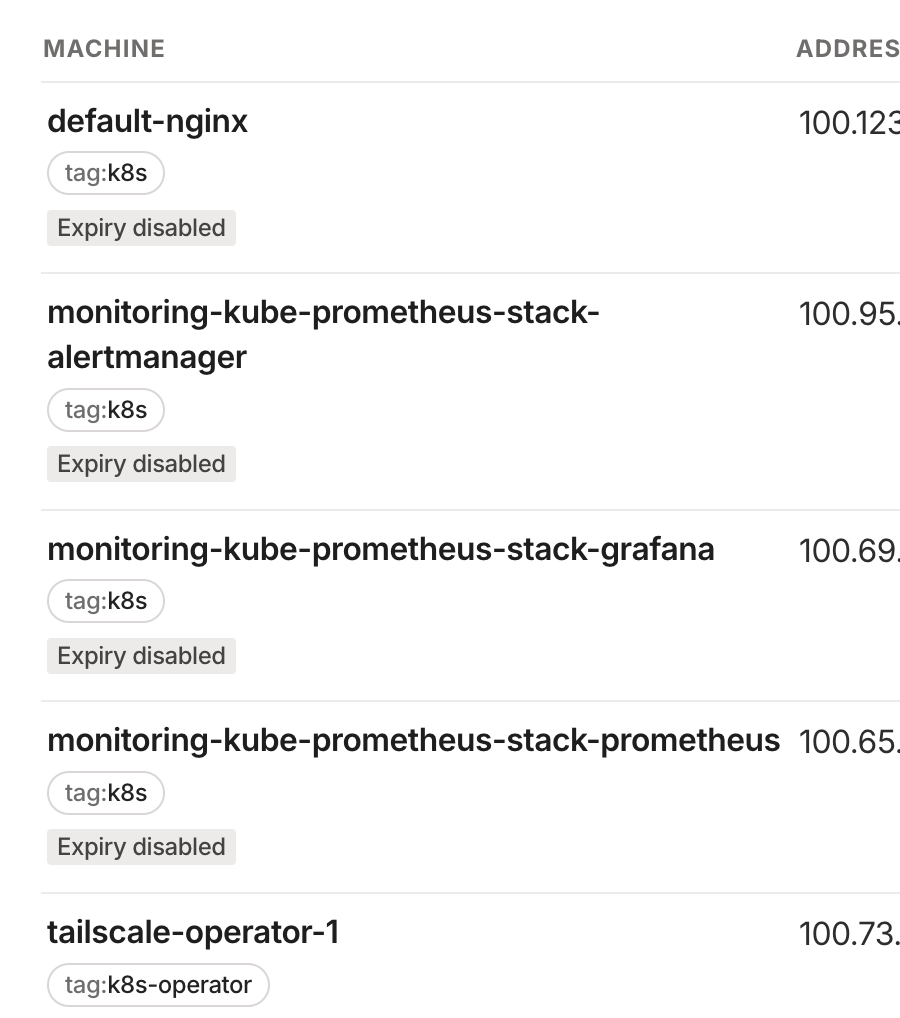
Installing monitoring with helm
Now, we add the monitoring stack (Prometheus, Grafana
# before running this, login to azure via cli
git checkout features/crcr-aksmonitoring
# this is the local install on kind:
cd helm/monitoring
make cluster-up monitoring
If you are working with AKS (private), you can find there how to create an OAuth Client for the tailscale operator to later access your deployments https://tailscale.com/learn/managing-access-to-kubernetes-with-tailscale
Replace the oauth_client parameters with your values
az aks command invoke --resource-group rg-service-crcr --name k8s-crcr --command "helm repo add tailscale https://pkgs.tailscale.com/helmcharts && helm repo update && helm upgrade --install tailscale-operator tailscale/tailscale-operator --namespace=tailscale --create-namespace --set-string oauth.clientId=<oauth_client_id> --set-string oauth.clientSecret=<oauth_client_secret>"
cd helm/monitoring
❯ az aks command invoke --resource-group rg-service-crcr --name k8s-crcr --command " helm repo add prometheus-community https://prometheus-community.github.io/helm-charts && helm repo update && helm upgrade --install -f values.yaml kube-prometheus-stack prometheus-community/kube-prometheus-stack -n monitoring --create-namespace" -f values.yaml
az aks command invoke --resource-group rg-service-crcr --name k8s-crcr --command "kubectl get service kube-prometheus-stack-grafana -n monitoring -o yaml "
Add the tailscale annotation
az aks command invoke --resource-group rg-service-crcr --name k8s-crcr --command "kubectl apply -f grafana.yaml -n monitoring " -f grafana.yaml
Now, let's assume, you have the time to configure cert-manager to get you a certificate, then you can expose Grafana as ingress to tailscale.
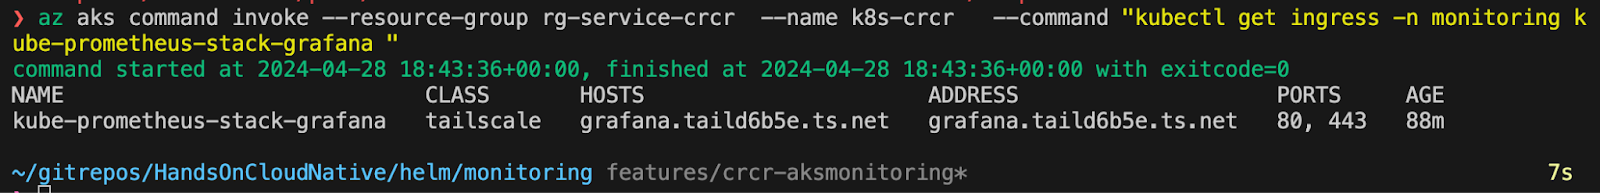
You can check your connection logs in the tailscale pod that is doing the forwarding.
az aks command invoke --resource-group rg-service-crcr --name k8s-crcr --command "kubectl logs pod/ts-kube-prometheus-stack-grafana-pz9j9-0 -n tailscale"
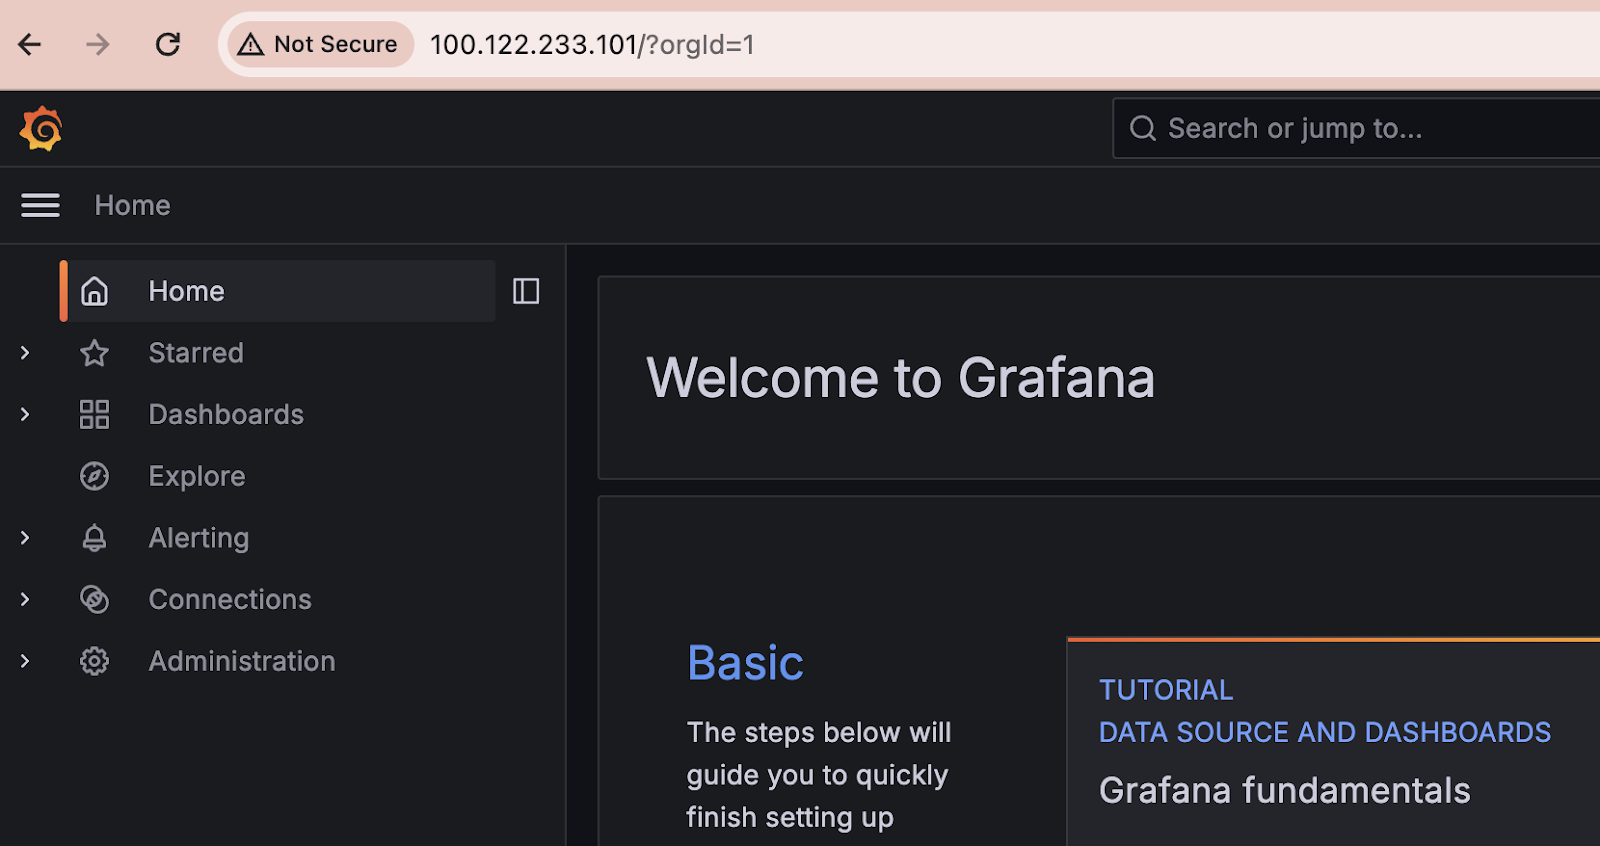
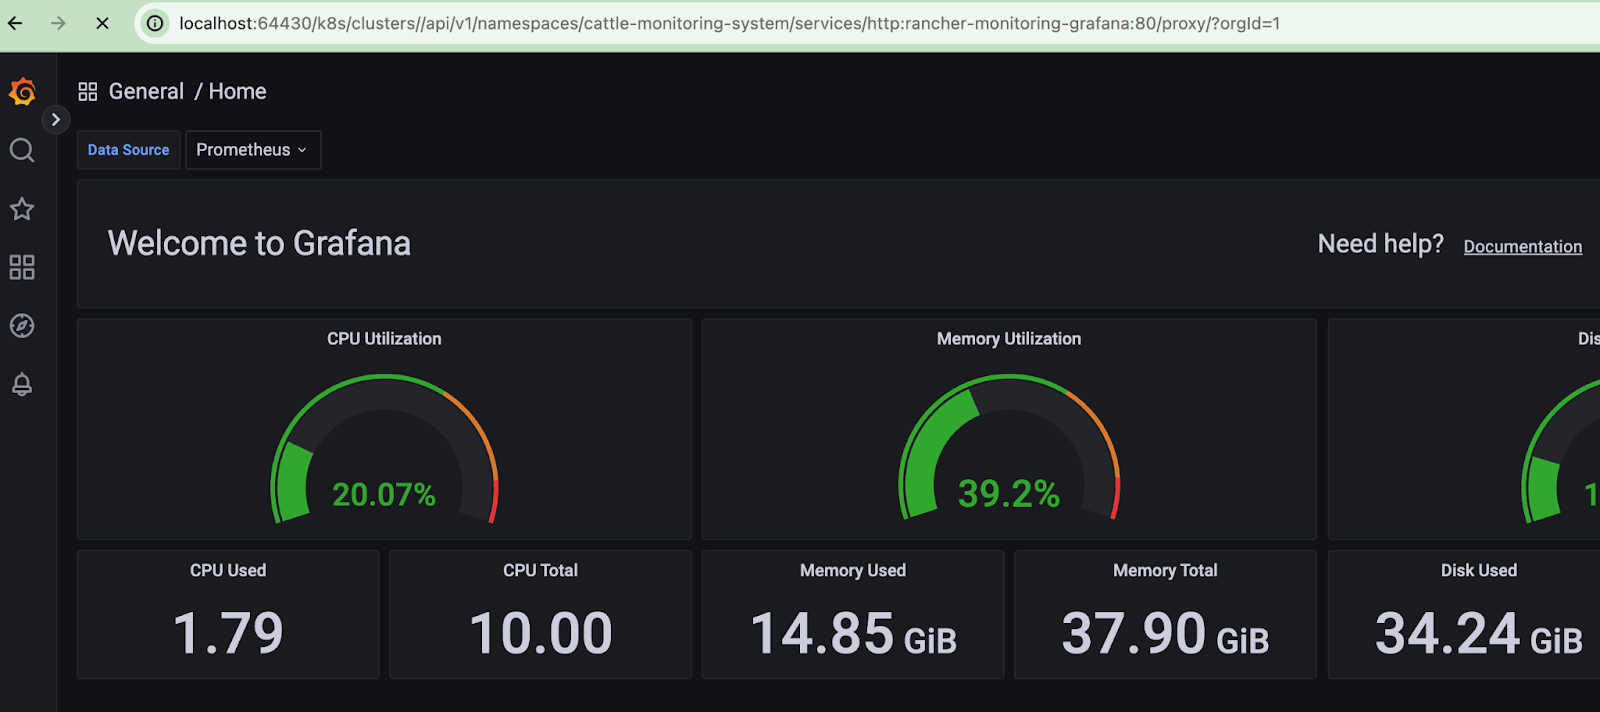
Also without certificates, we can go to the grafana dashboard (for kind, please just port-forward the service to somewhere on your local machine)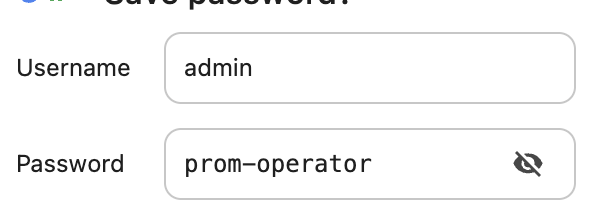
Use the default credentails to log in:
Now you have a Grafana, with Prometheus as default datasource
Go to the http://<yourip>/dashboards route and check out some dashboards.
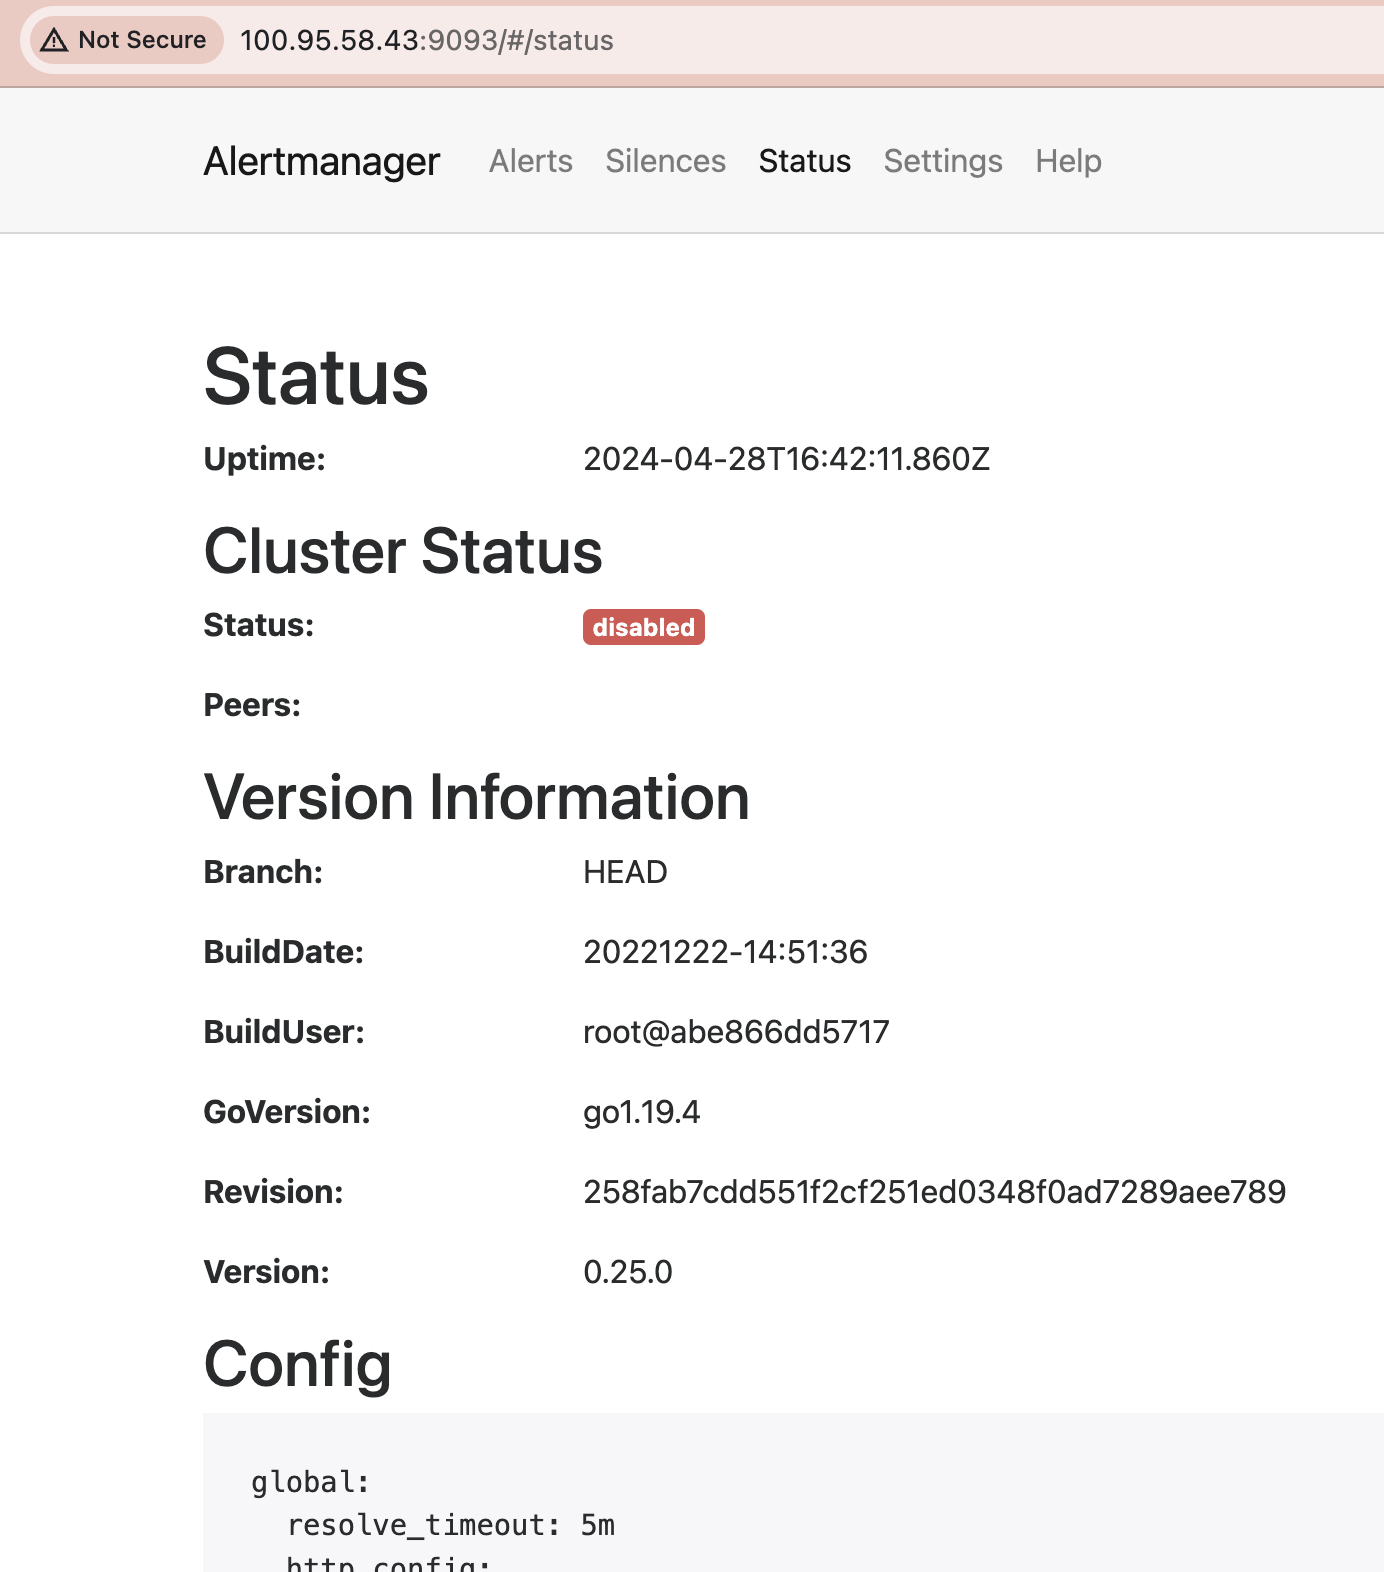
You could do the same thing with alertmanager; which is going to be empty, as well
Working with and Uninstalling the helm chart(s)
Maybe, we wish to fix things or simply find out what is going on: helm get all will give you A LOT of info.
az aks command invoke --resource-group rg-service-crcr --name k8s-crcr --command " helm get all kube-prometheus-stack -n monitoring "
That s a lot!
Possibly, looking at the values file is sufficient:
az aks command invoke --resource-group rg-service-crcr --name k8s-crcr --command " helm get values -a kube-prometheus-stack -n monitoring "
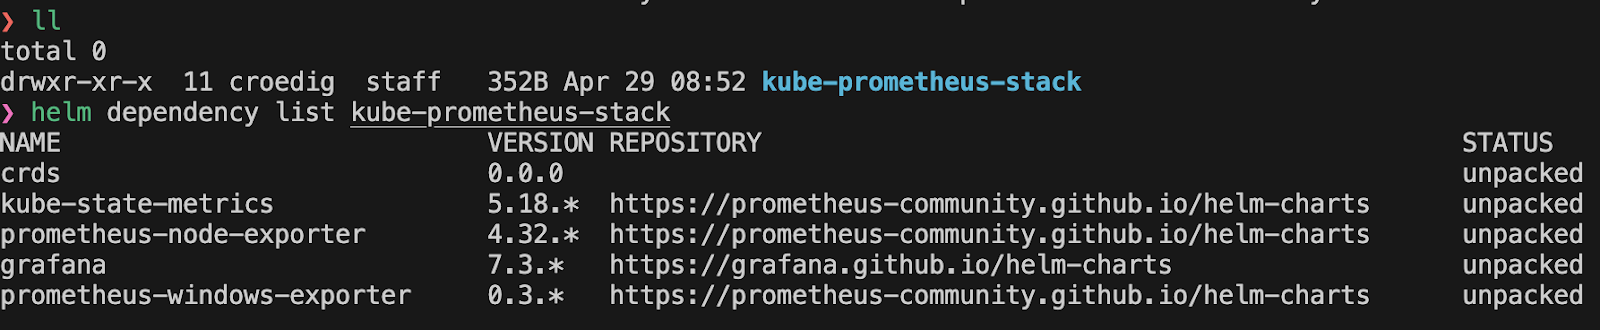
Let's look at the dependencies of the chart. For this, we need to pull the helm chart to our local machine (or somewhere where we can untar it)
mkdir pull
cd pull
helm repo add prometheus-community https://prometheus-community.github.io/helm-charts & helm pull prometheus-community/kube-prometheus-stack --untar

az aks command invoke --resource-group rg-service-crcr  --name k8s-crcr   --command "kubectl get service kube-prometheus-stack-grafana -n monitoring -o yaml "
In case, you need to uninstall it, let's do a dry-run first and then if that doesnt throw any errors, a full uninstall:
cd helm/monitoring
❯ az aks command invoke --resource-group rg-service-crcr --name k8s-crcr --command " helm uninstall kube-prometheus-stack -n monitoring --dry-run"
What did we learn:
Getting the "monitoring stack to work and configure it with really useful data" is very much possible, but it's gonna take a while (like a long while).
On RKE2
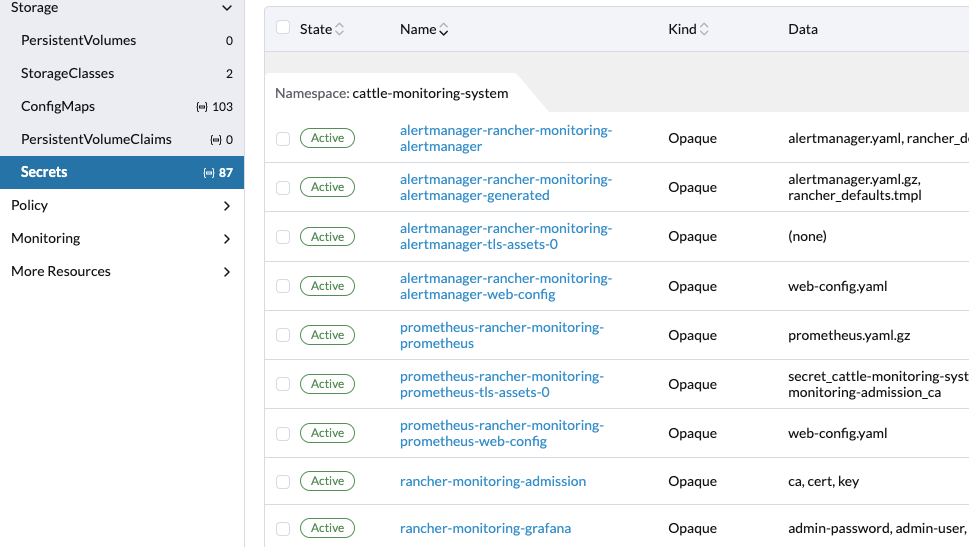
This one ALREADY HAS MONITORING installed.
Exercise: Find out how it was installed. (Hint: its helm, but different)
Exercise: Login to Grafana
First grab the Grafana password:
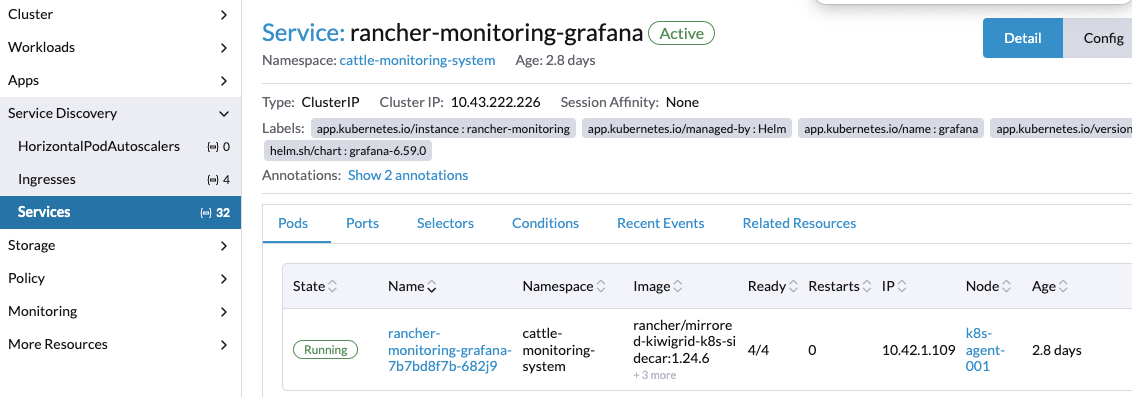
Port forward the service
Now, we ll add the cilium standard dashboard to grafana
Google the right dashboard ID and add it to Grafana. (Dashboards-> Import)
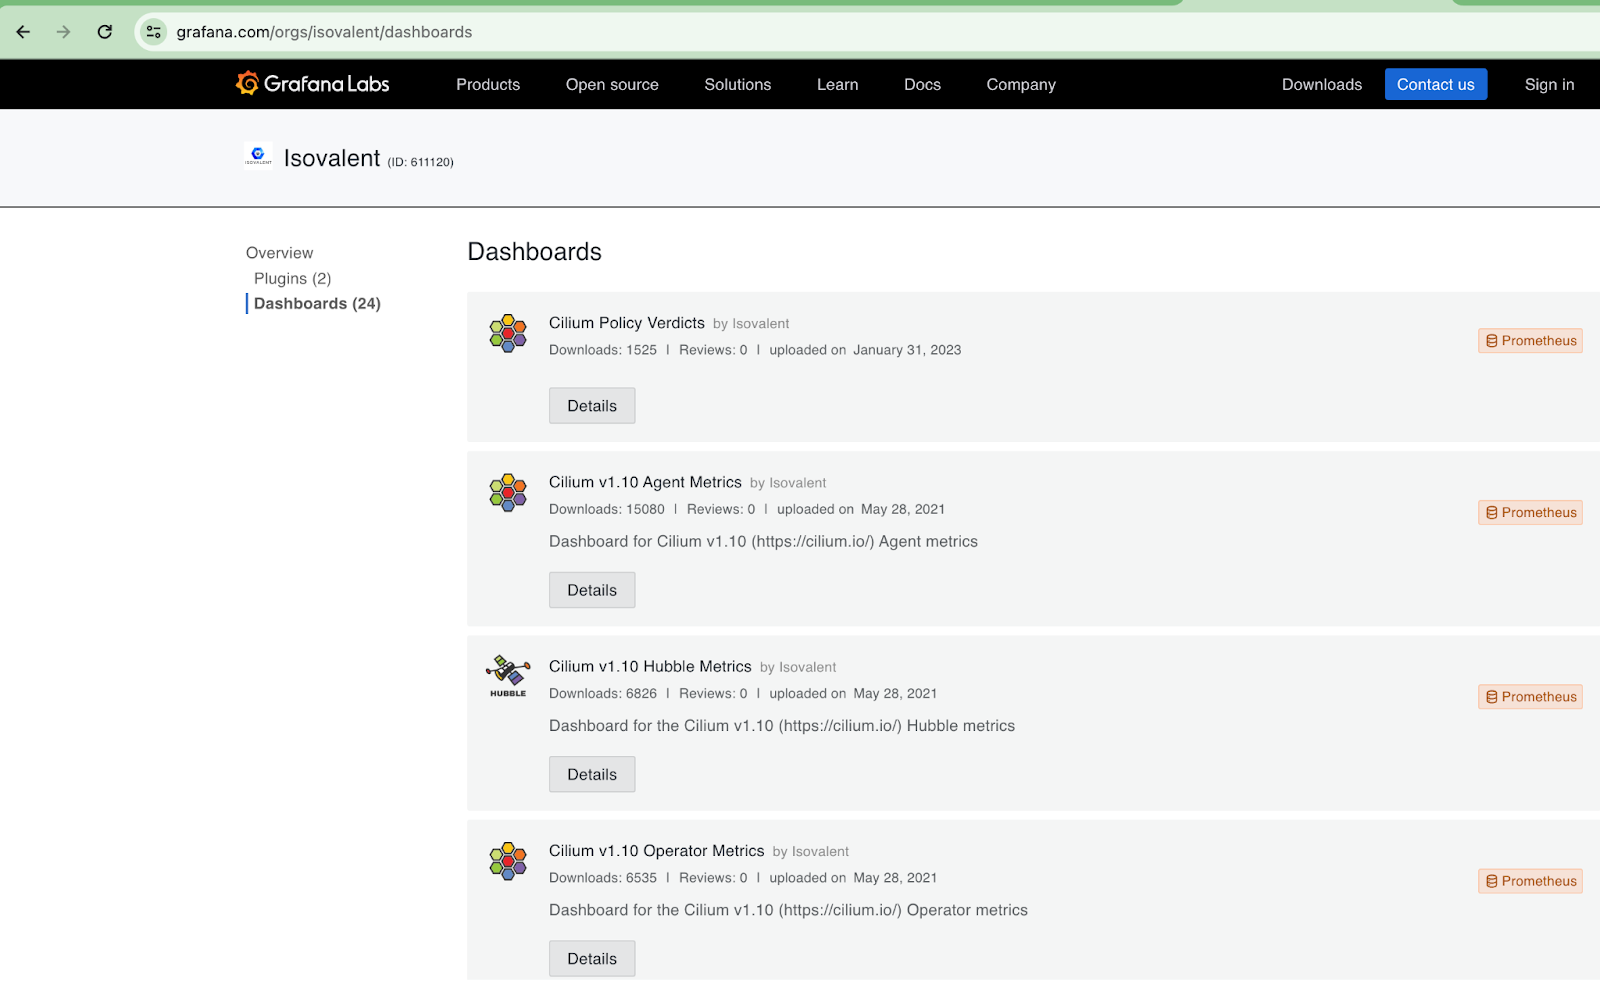
It will be empty :)
Exercise: Discuss why it is empty -> which configuration would we need to add to see the cilium metrics?
For a slightly less demotivating exercise, go to the preconfigured dashboards in Folder General.
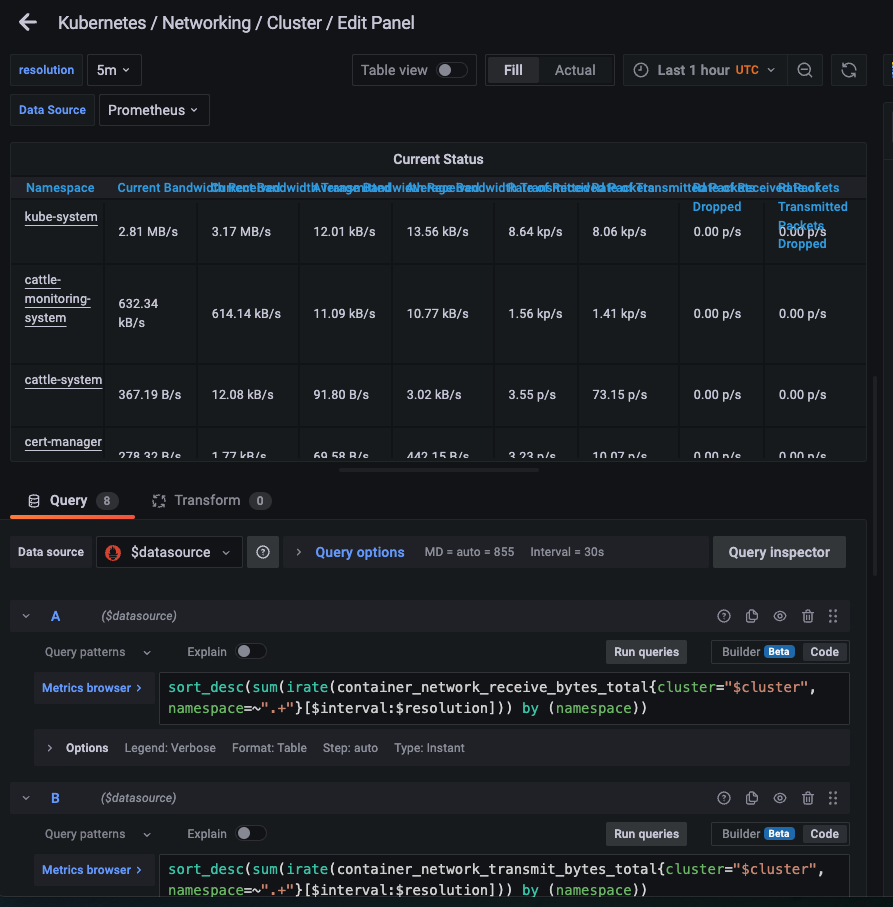
Alright: finally we found some data in the dashboard. Hurray !!!
Conclusion:
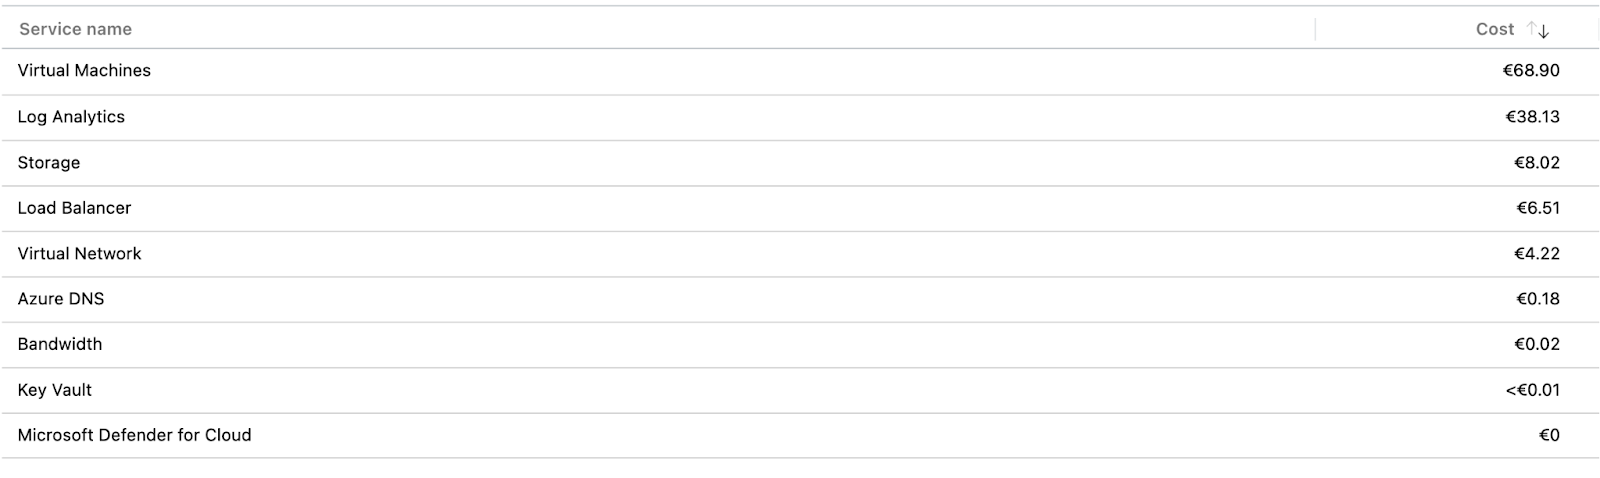
Do not underestimate the complexity of dealing with the "famous stacks" (for which we used the prometheus-grafana stack): , you need to deploy them, configure them, maintain them, and hopefully actually look at their data. They cost additional money for storage, network and security-monitoring (yes, you need to monitor the monitoring cluster...)
It is well worth a TCO calculation, if managed dashboards are better for you.
Please do a calculation before going with "a I ma use the FOSS solution anyway, cause its free" - free is rather relative.
We ll compare now some integrated AKSand GKE features that you can let the CSP handle for you
Just in case, you found the prometheus stack slightly intimidating, well: you don't have to do it yourself: you can add-on the service from the big CSPs and pay for them.
Starting in Azure
Here is the official pricing info https://azure.microsoft.com/en-us/products/managed-grafana/#pricing for a managed prometheus/grafana
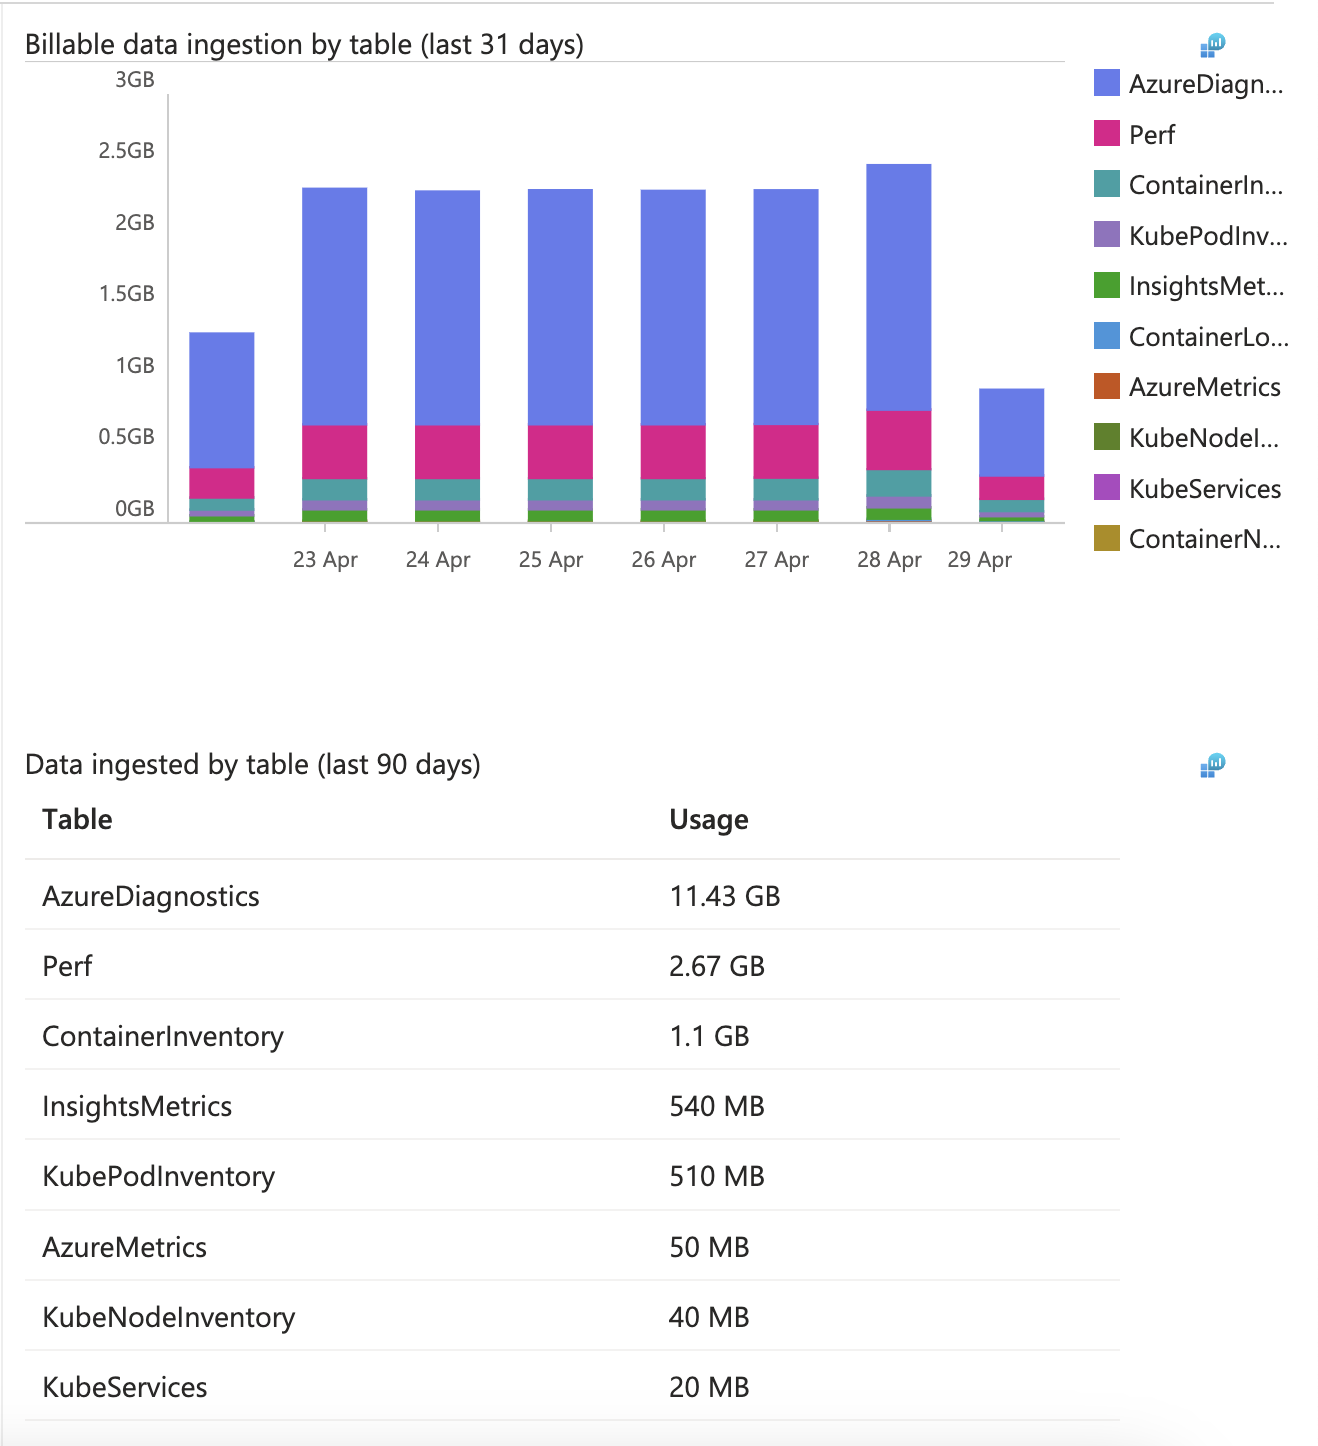
In cloud, it is extremely important to separate the telemetry into a out-of-band storage as fast as possible after it has been produced. Given that much of cloud components are ephemeral, the logs/metrics/traces/events disappear if the main components disappear, plus most deployments are distributed, and having the data in one place helps tremendously during troubleshooting and/or auditing.
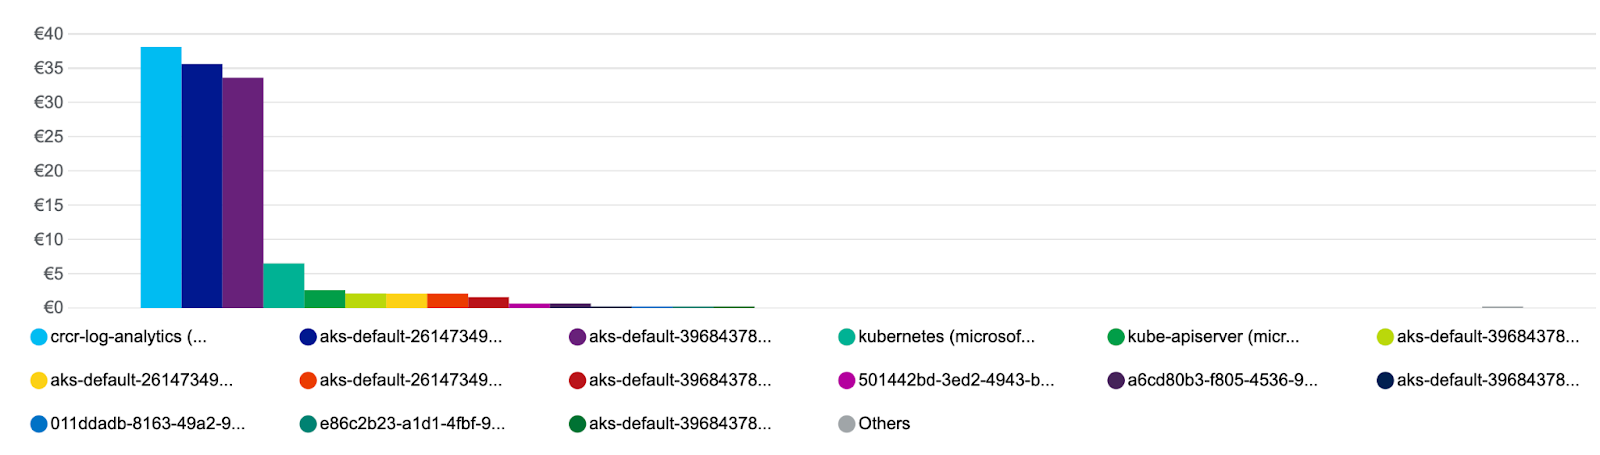
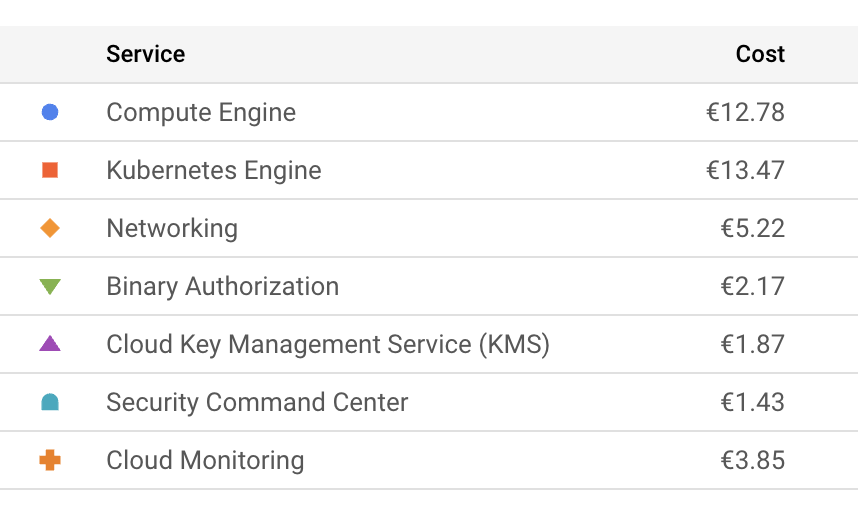
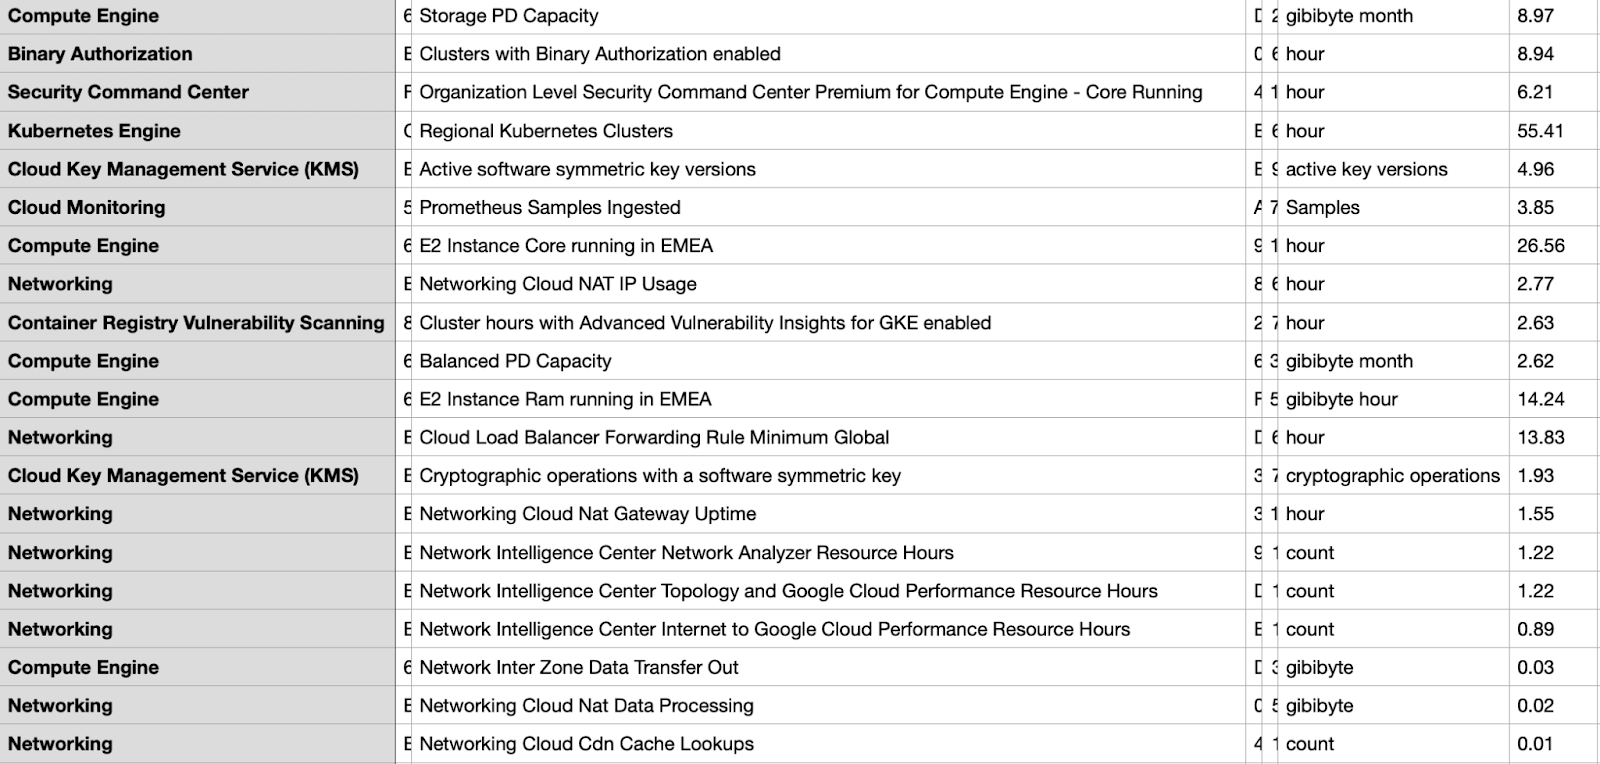
Quick comparison with GKE pricing (please look only at relative prices since the billing is setup totally different)
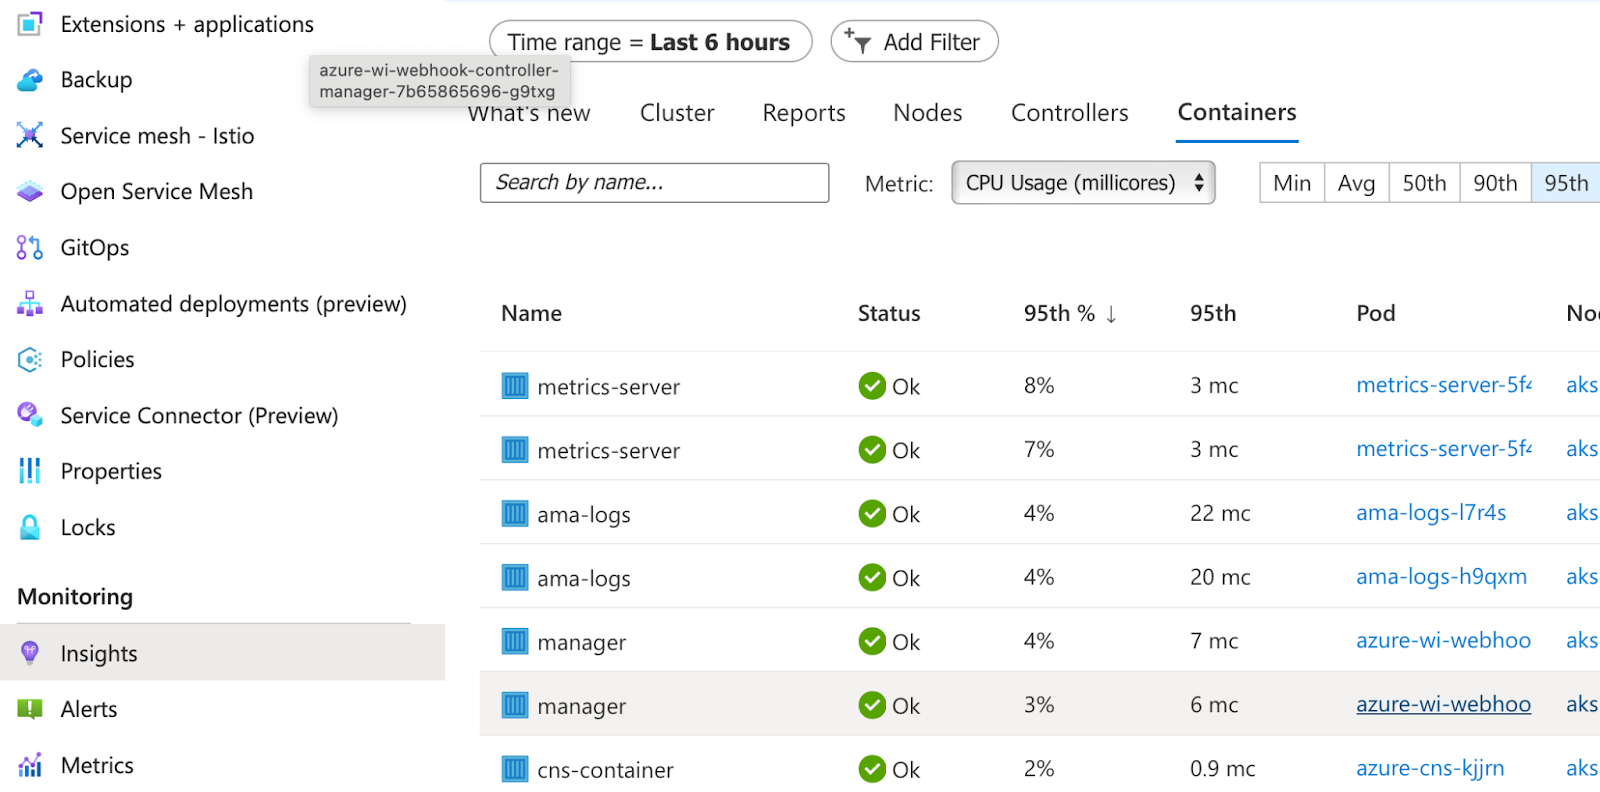
We see that we have a managed grafana , this time from Azure and we dont need to expose any loadbalancers or ingresses to access it.
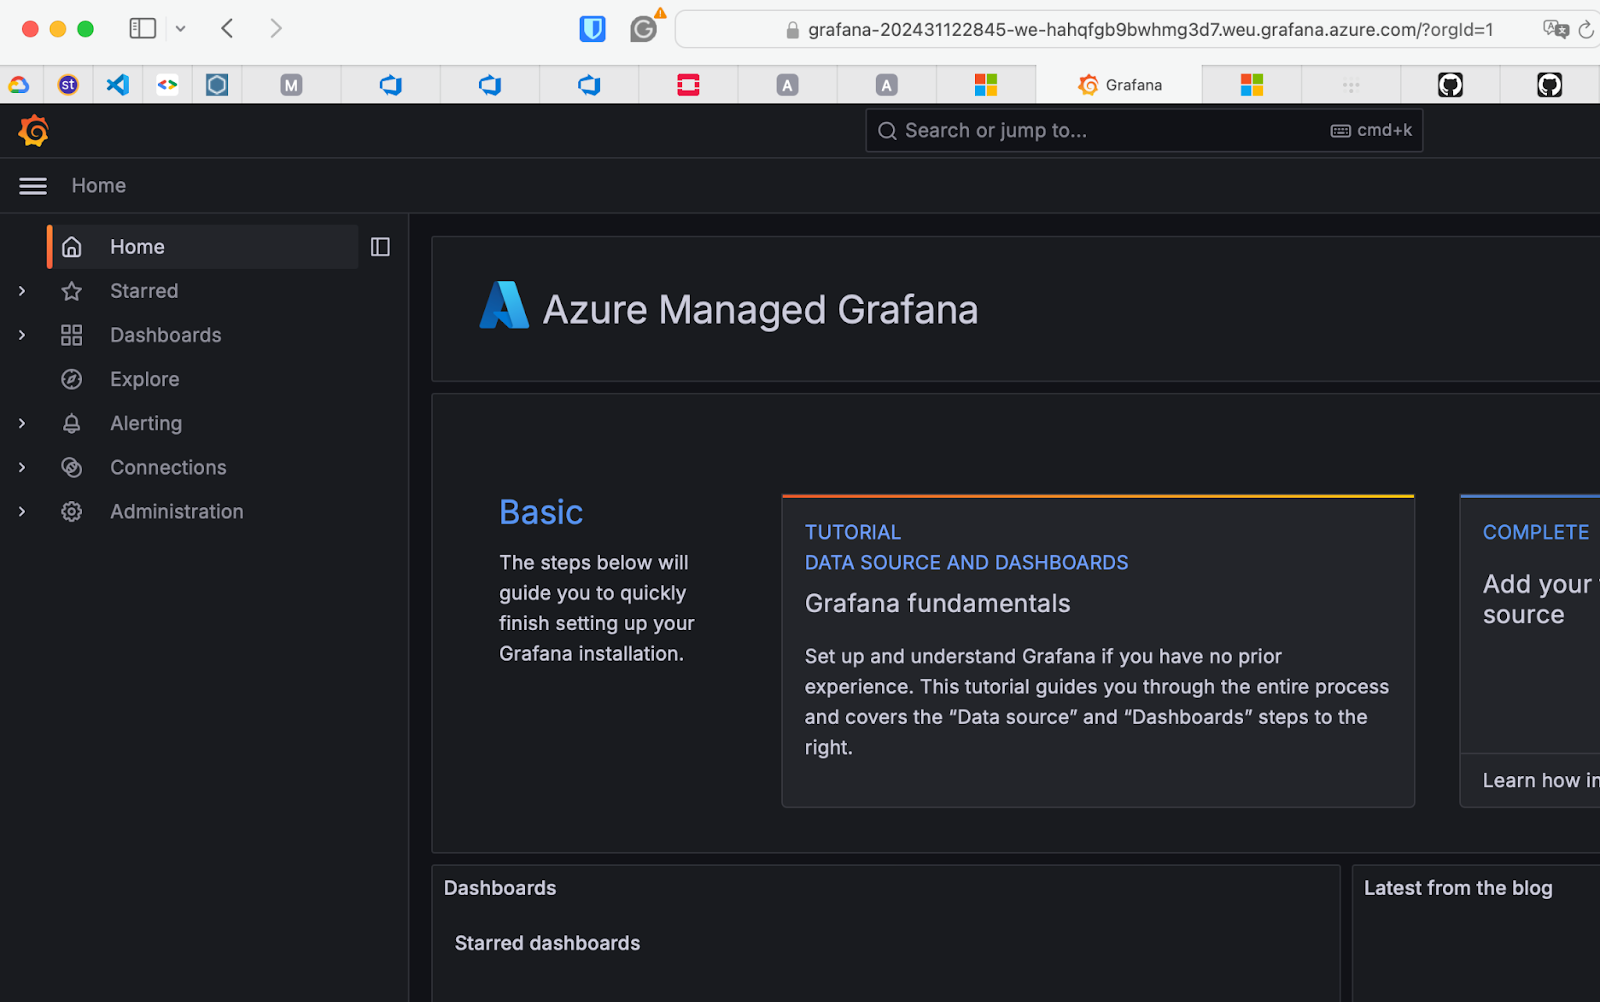
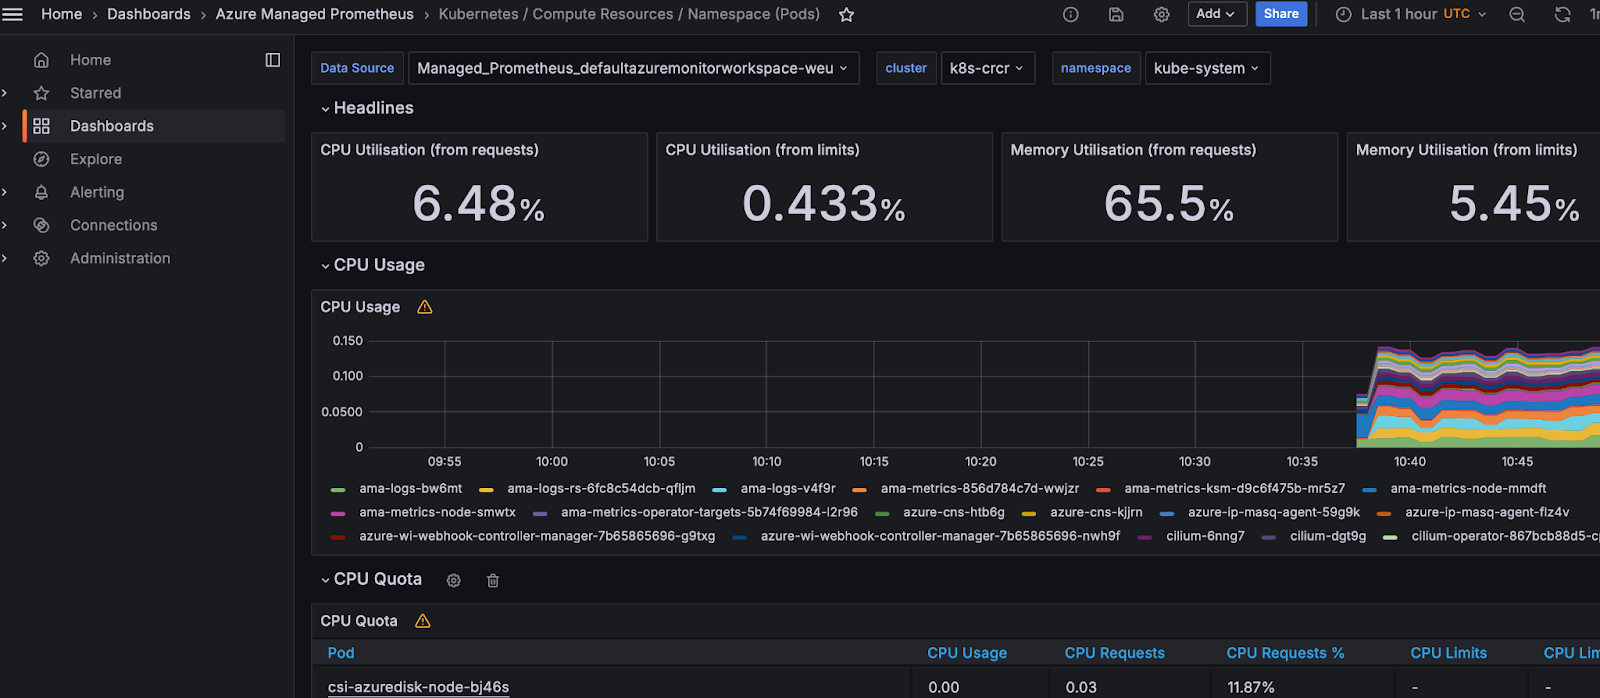
The standard dashboards are relatively similar to the ones that we get for free on RKE2
Here is a repo that also specifies some grafana dashboards to be added via terraform https://github.com/zioproto/istio-aks-example/blob/3548f08ca77e22790f611532a9a558e443c1a43a/istio-on-aks-with-managed-prometheus-grafana/aks-tf/prometheus.tf#L115-L120
In order to automatically load preconfigured dashboards, you can click something manually in grafana, export it as JSON and save it live in the below: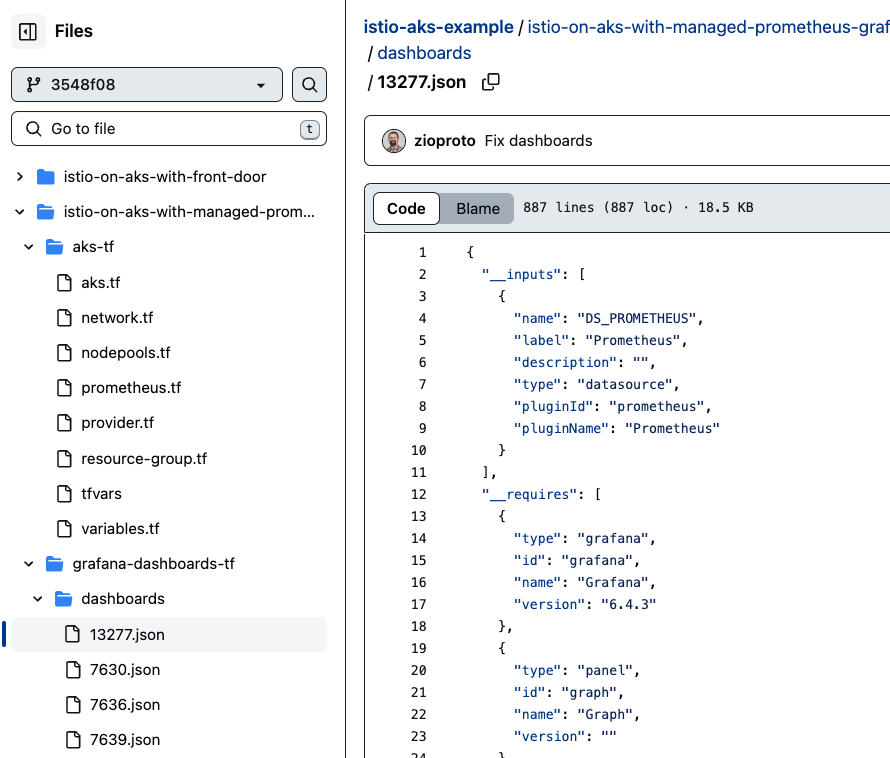
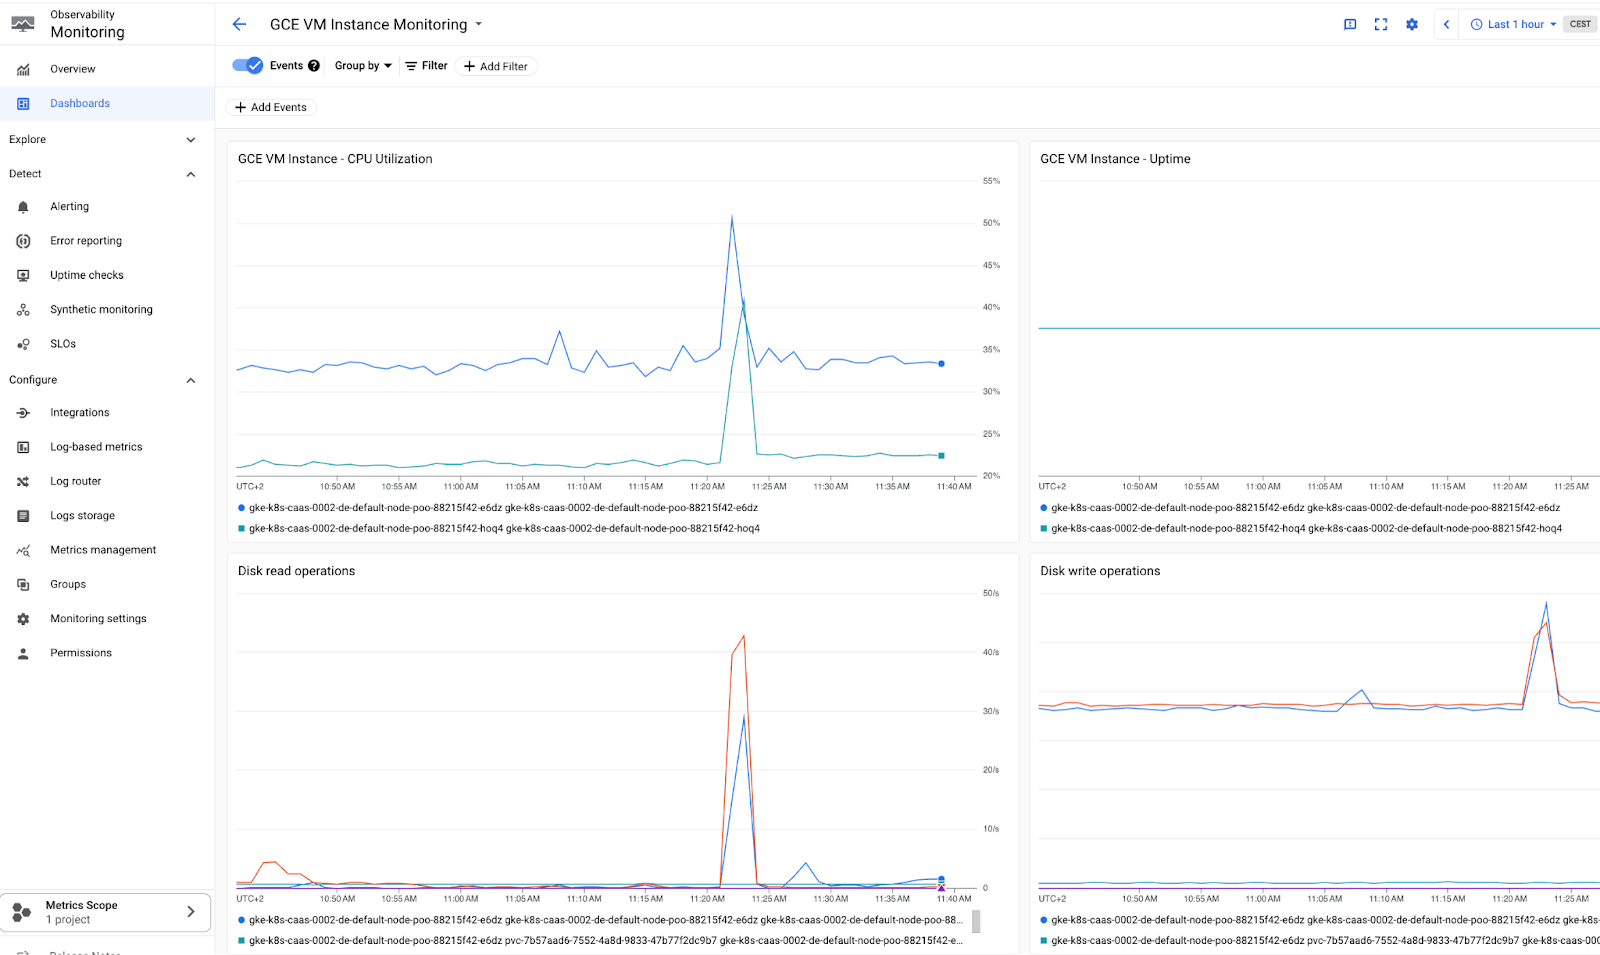
More of the same , but on GCP
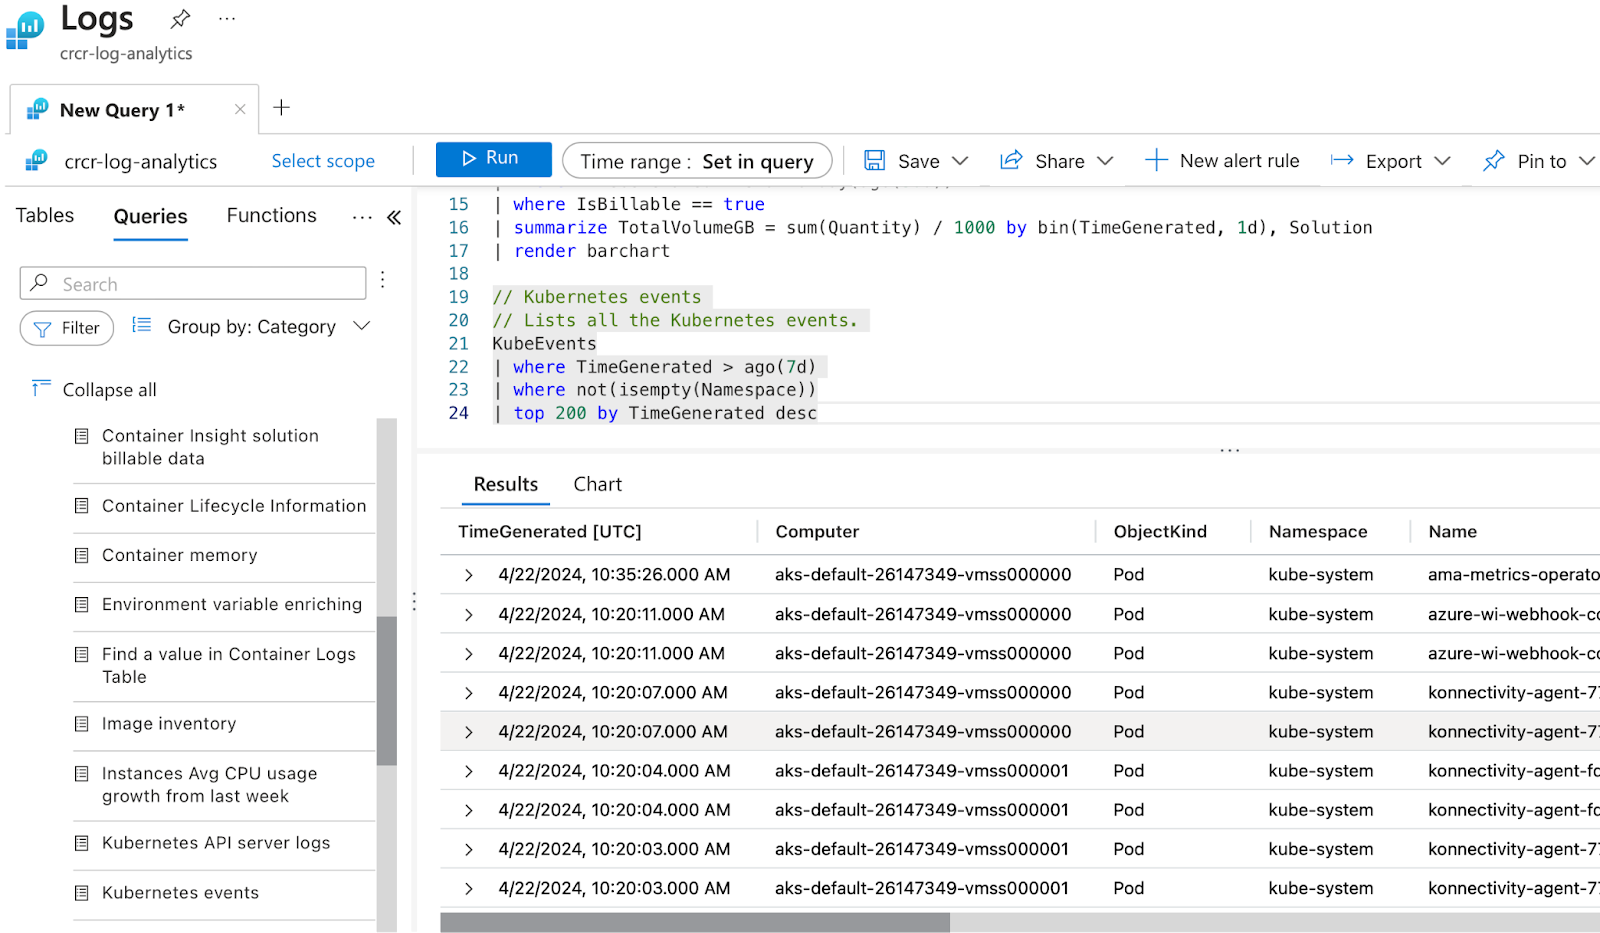
Logging:
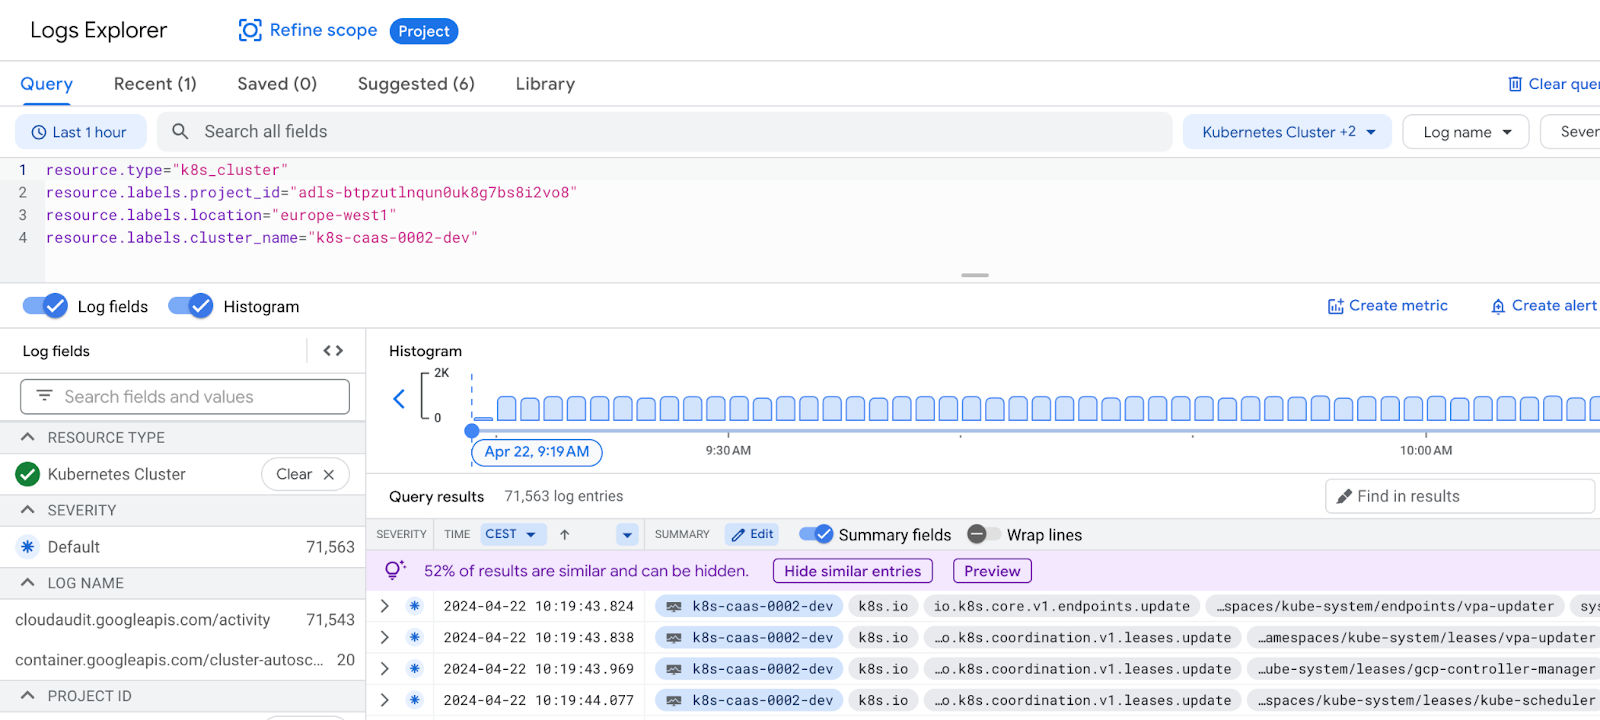
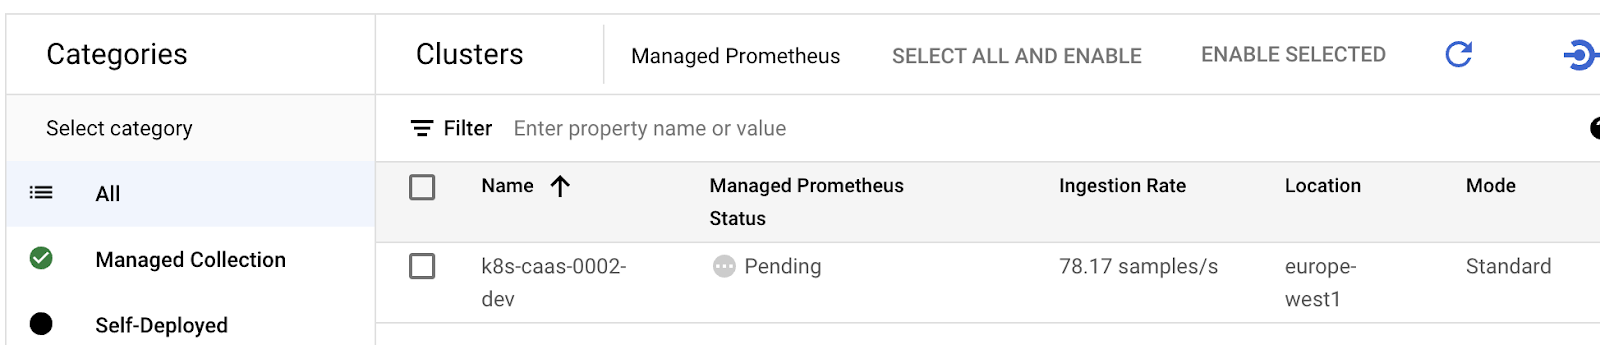
This is interesting e.g. for audit-logs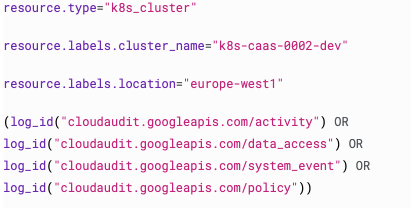
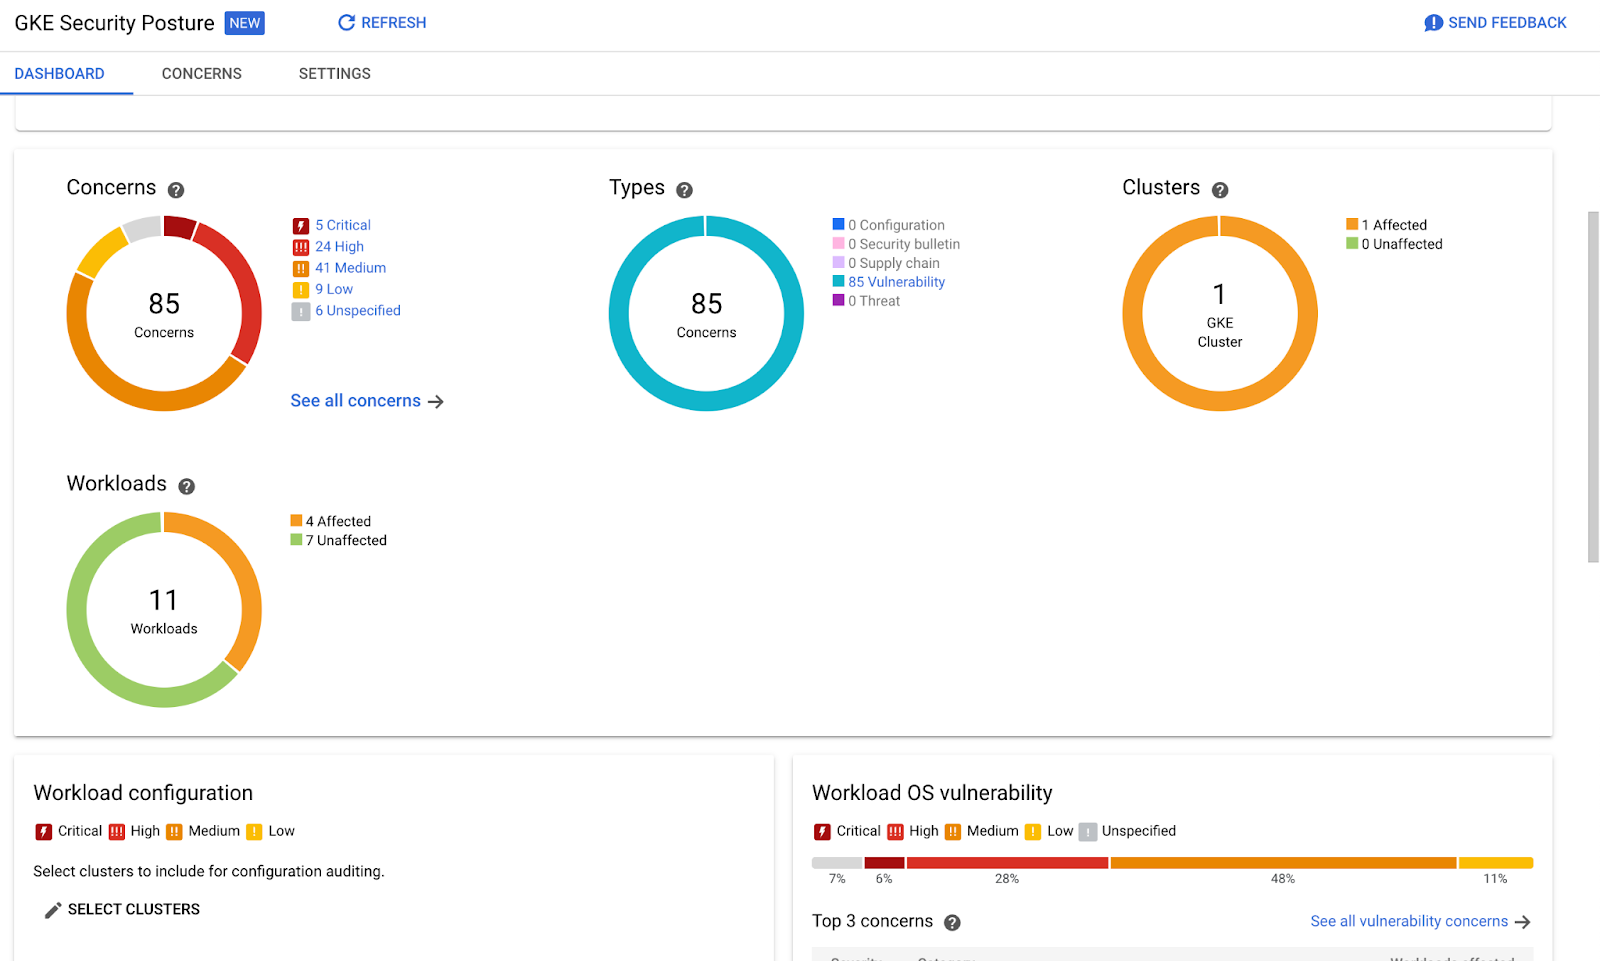
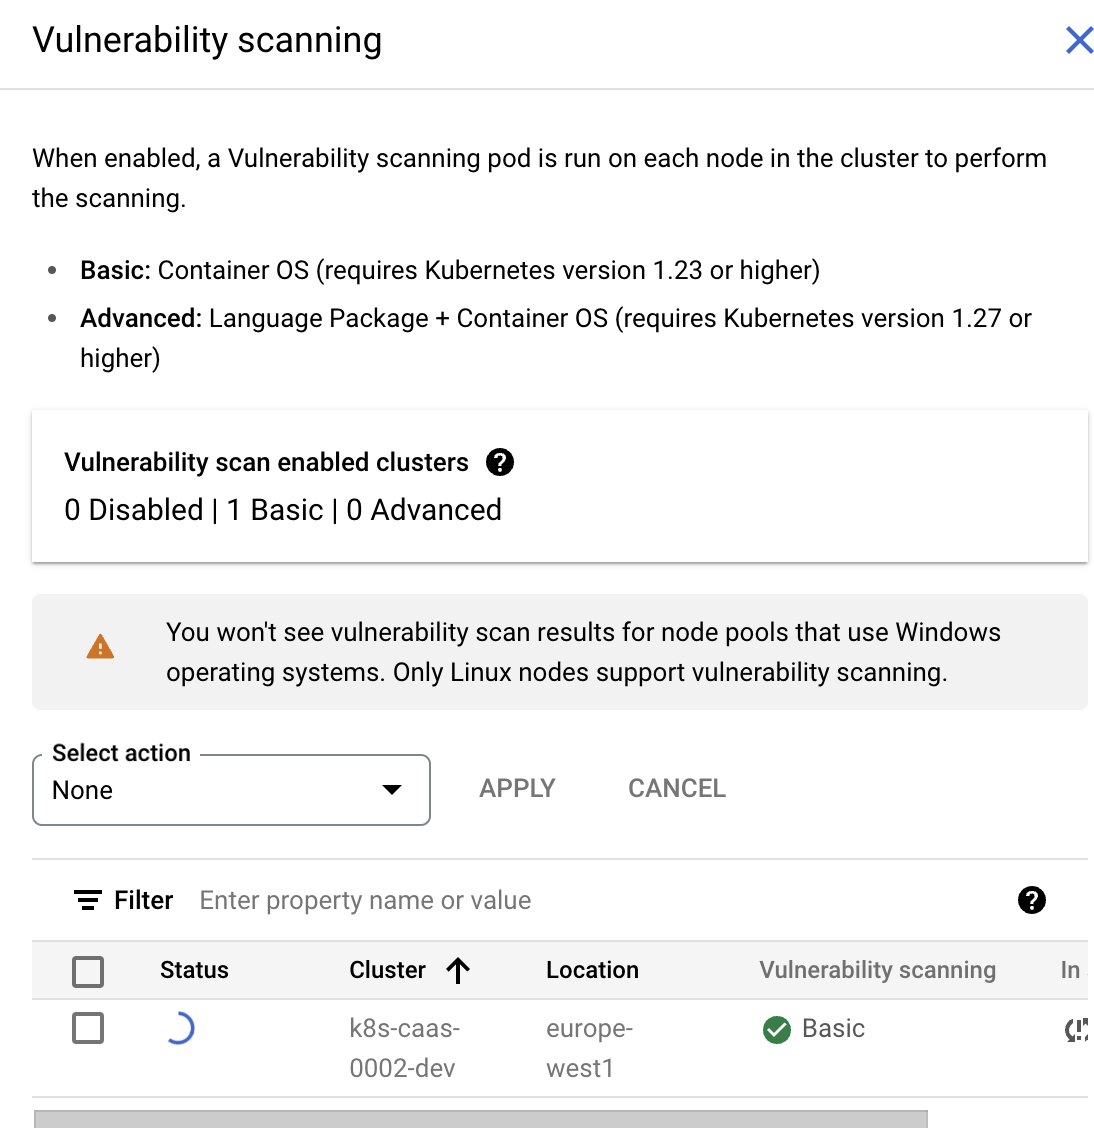
Here we see that we can pay Google to automatically scan out workloads for CVEs (both OS or -if you pay some more- also for the language features):
Classroom discussion:
Which parts of the above are considered vendor lock in?
Which managed features would you choose? And Why?
We ll package your kubernetes manifests into helm
We will now take your manifests (from last week, plus what your team did for homework) and package them into a Helm Chart.
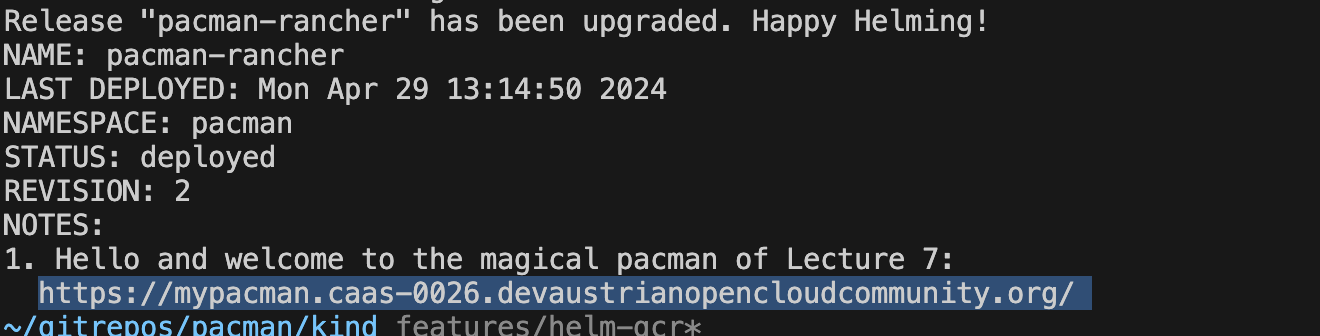
First however, you can demo it to yourself using our beloved pacman app, you ll find a Makefile in the branch features/helm-gcr
# check your k8s context to be on KIND
Git checkout pacman  features/helm-cgr
#export pacman=<Namespace where you will deploy pacman>
#helm create charts/pacman-custom
make helm-create
There are several exercises including installing the chart with an ingress to your RKE2 cluster (remember, please, that Let's Encrypt has a limit on how many certs we can get per week, so don't create/delete ingresses for fun, only very intentionally)
The `helm create` command creates a directory and populates it with files
according to a standardized structure. Again, you can read about the [helm
create](https://helm.sh/docs/helm/helm_create/) command in the helm
documentation.
For the purposes of our pacman application, it's instructive to read
[this blog post](https://veducate.co.uk/how-to-create-helm-chart/).
This documents how the author created the original helm chart.
Once you've added the necessary files and values to the chart, it's time to
package the chart. This involves creating an archive that is later used to deploy
the chart onto the cluster.
Helm 3.7.0 and above support OCI for package distribution. OCI (Open Container Initiative) is a set of industry standards to enable interoperability between container tools. The advantage of using OCI is that it allows Helm charts to be stored and shared through any OCI-compliant registry, such as Docker Hub, Azure Container Registry (ACR), Google Container Registry (GCR), and others.
Here are the steps to package and push a Helm chart as an OCI artifact:
- Enable the OCI experimental feature in Helm:
export HELM_EXPERIMENTAL_OCI=1
Log in to your OCI registry:
helm registry login -u USERNAME -p PASSWORD REGISTRY_URL
Package your Helm chart as an OCI artifact and push it to the registry
helm chart save CHART_DIRECTORY REGISTRY_URL/PROJECT/CHART_NAME:VERSION
helm chart push REGISTRY_URL/PROJECT/CHART_NAME:VERSION
The inverse is also possible.
And of course you can install the local files directly, as well.
helm chart pull REGISTRY_URL/PROJECT/CHART_NAME:VERSION
helm chart export REGISTRY_URL/PROJECT/CHART_NAME:VERSION --destination ./charts
helm install RELEASE_NAME ./charts/CHART_NAME
Kustomize
I started rewriting everything for kustomize and also to show how to connect passwordlessly with an external MongoDB, and it will be in the folder kustomize on the same branch:
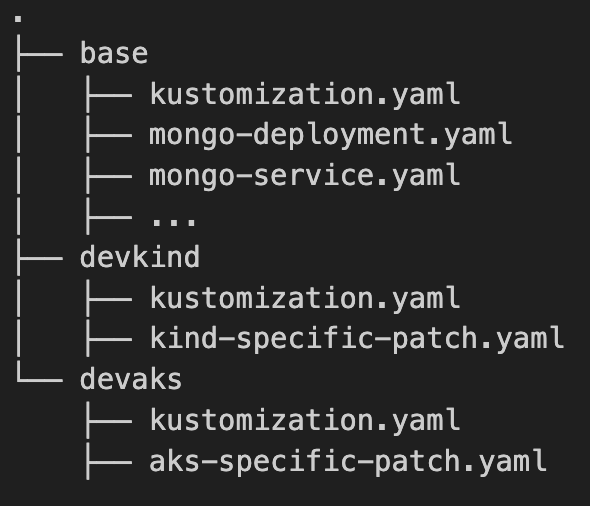
# for the base directory:
cd pacman/kustomize
gitrepos/pacman features/helm-gcr*
❯ kustomize build base
apiVersion: v1
data:
  ping-mongodb.sh: |
    #!/bin/bash
    mongo --port $MONGODB_PORT_NUMBER --eval "db.adminCommand('ping')"
  readiness-probe.sh: |
    #!/bin/bash
...
You can look into the script.sh to see the commands to create the final manifests.
❯ kustomize build devaks > devaks.yaml
# Warning: 'bases' is deprecated. Please use 'resources' instead. Run 'kustomize edit fix' to update your Kustomization automatically.
# Warning: 'patchesStrategicMerge' is deprecated. Please use 'patches' instead. Run 'kustomize edit fix' to update your Kustomization automatically.
Whereever possible we can get temporary tokens instead of copying secrets all around
We will cover this in detail in Lecture 13, but for now, you may want to have a working example of a dynamically deployed identity , that makes a kubernetes deployment-pod be able to get a secret from a keyvault WITHOUT ANY SECRETS BEING INVOLVED.
The key lies in creating an identity for the service account that you pod will later use
branch features/crcr-aksmonitoring
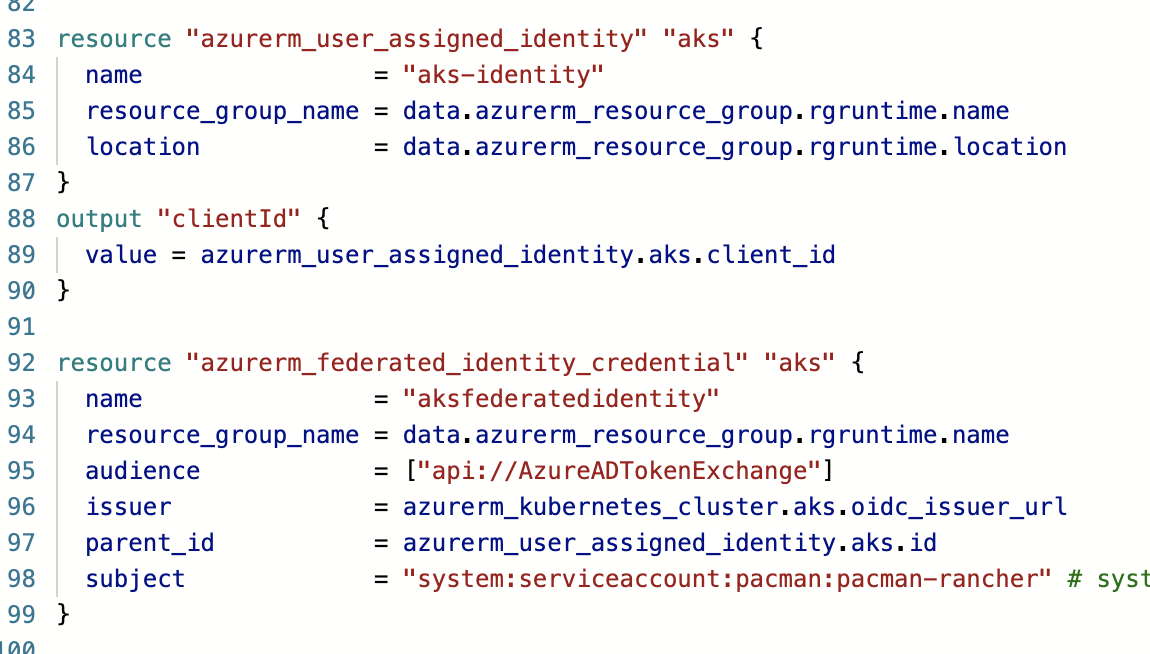
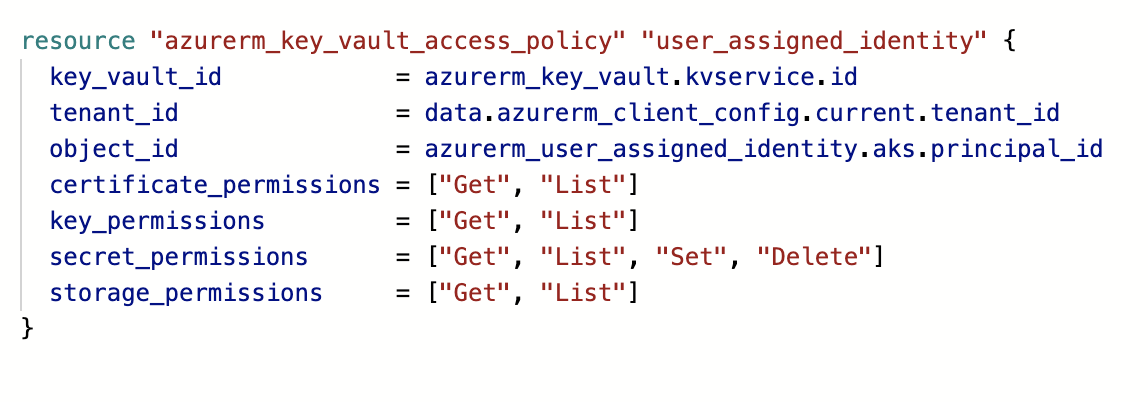
And assigning it the role to access whatever you want it to have access to, e.g. the keyvault:
Once you retrieve the client-id of this azurerm_user_assigned_identity , you can use it in a deployment like here deploy.yaml 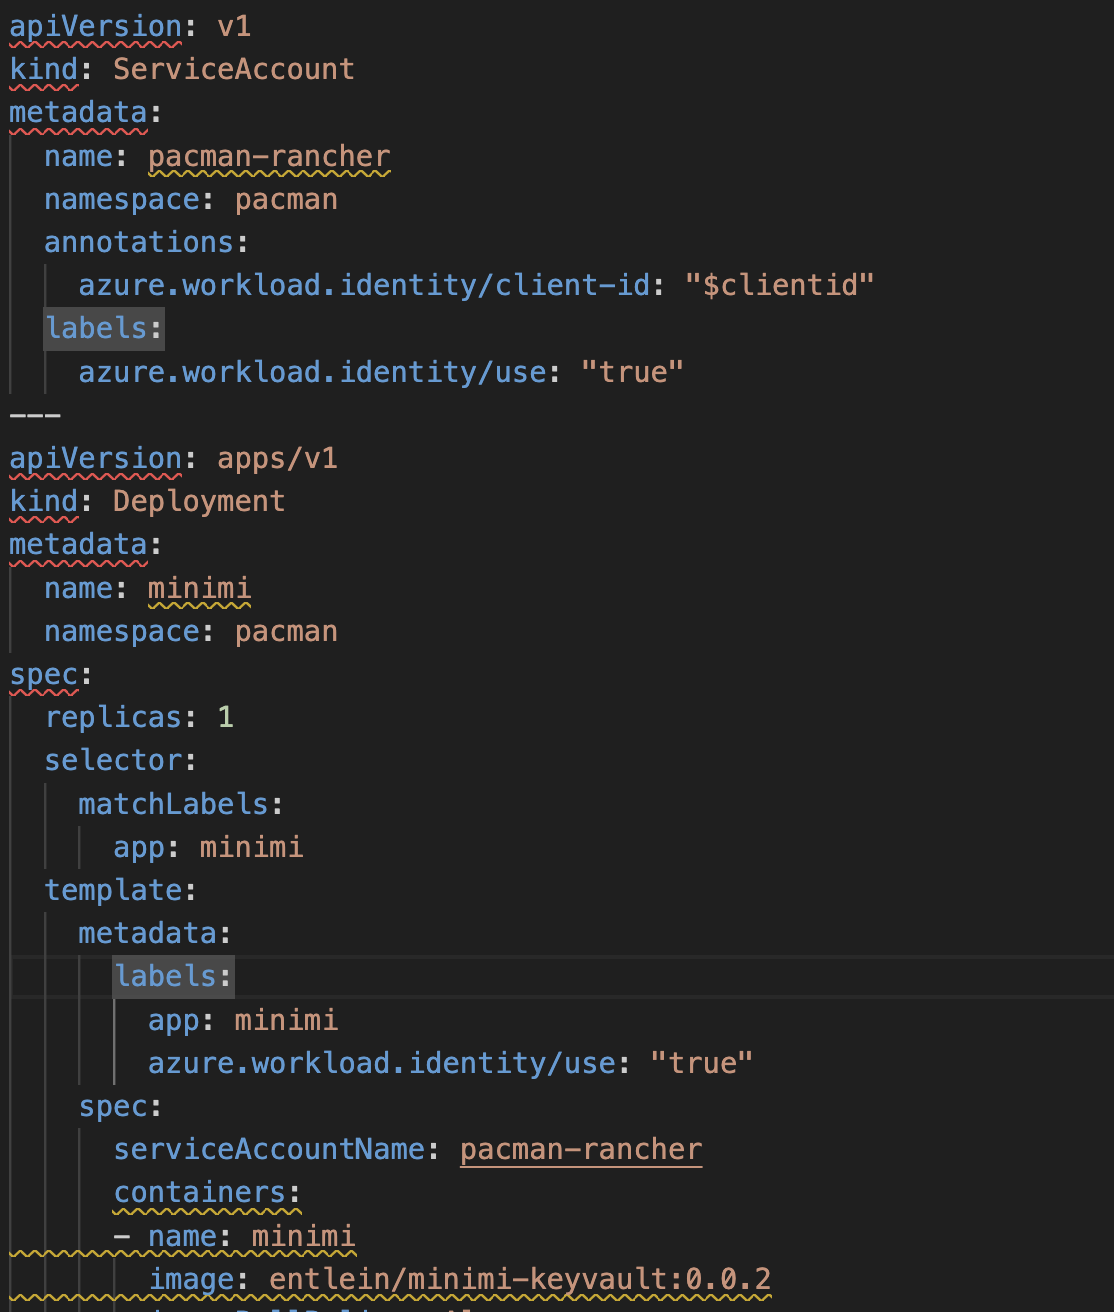
Now, we can use the azure-libraries (for your language of choice) and exchange this pod-identity with a valid token , like here server.js
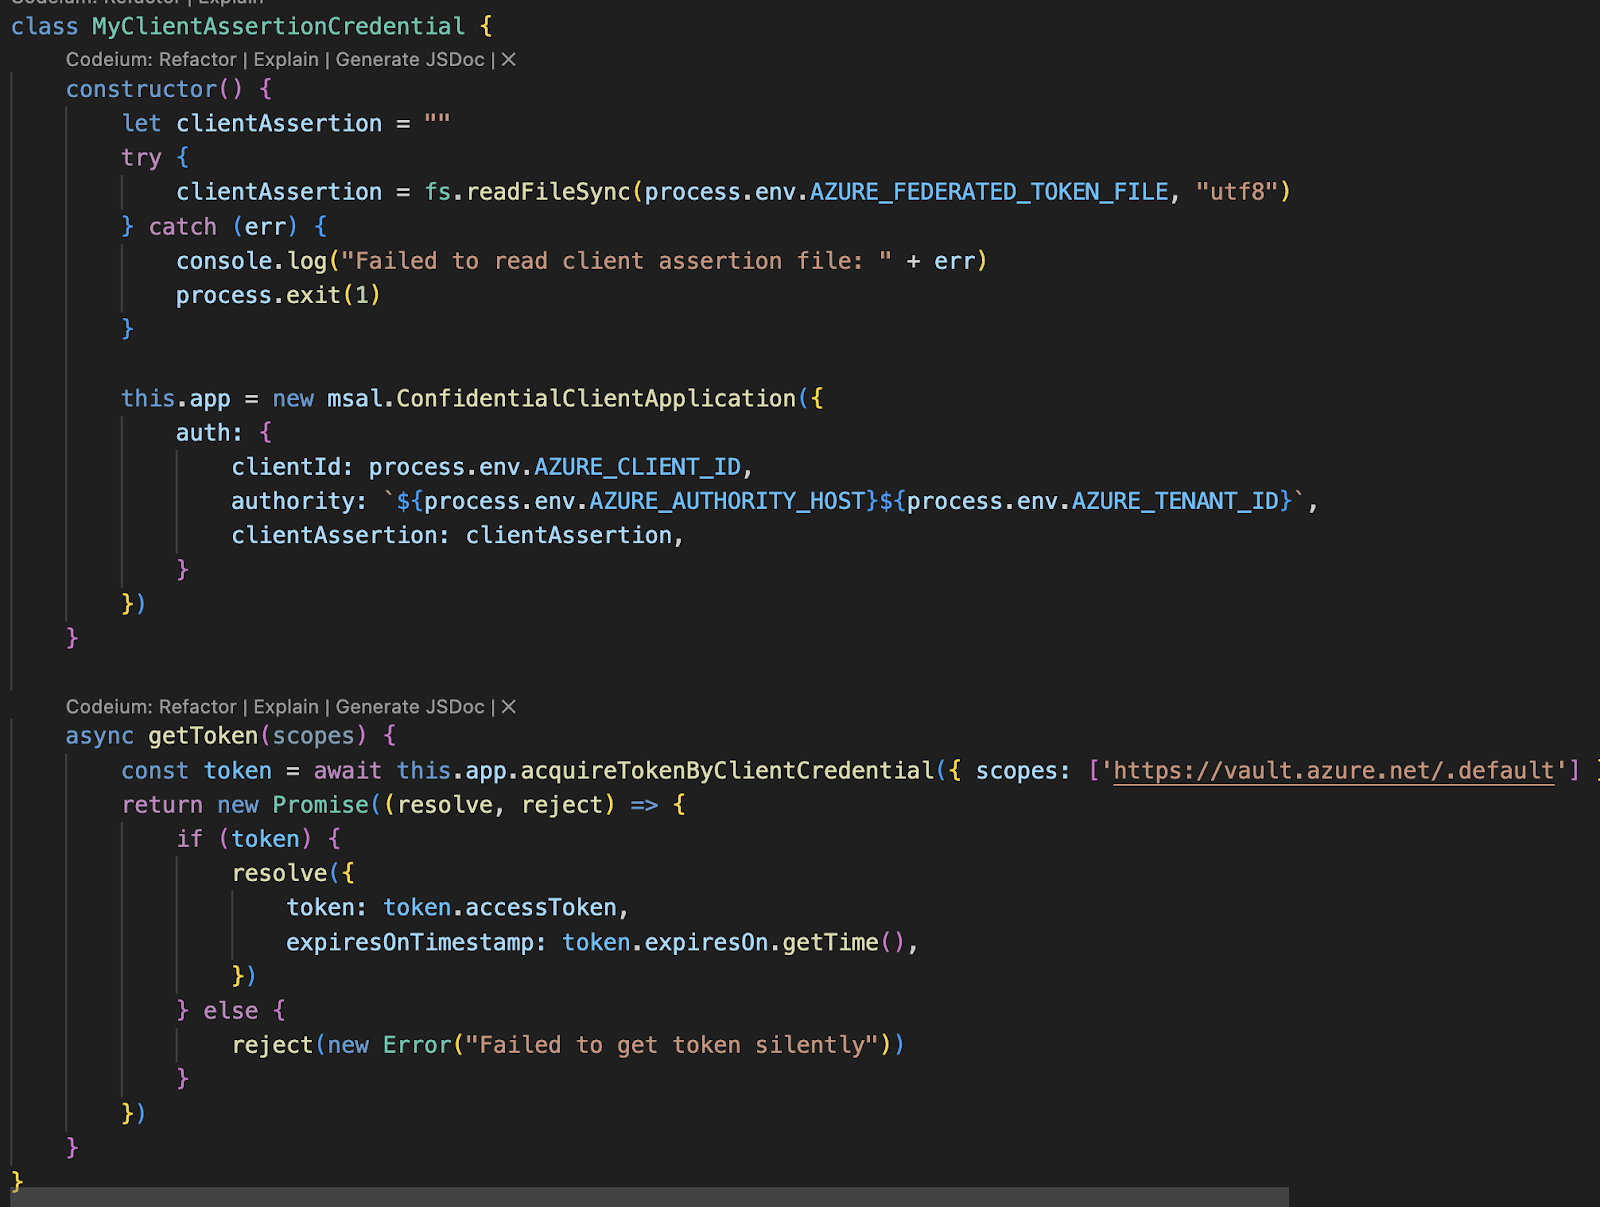
This works out of the box, because your pod will have those environment variables set automatically.
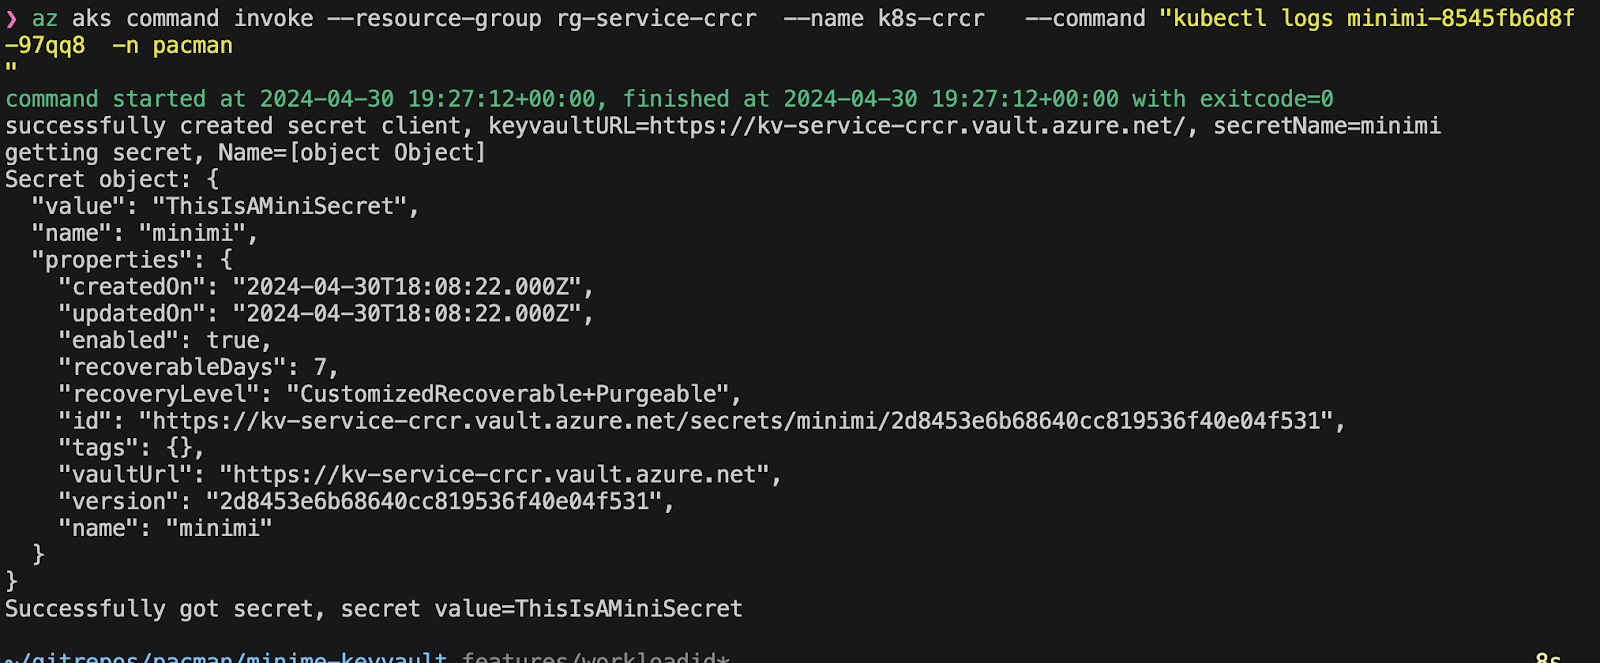
This is a way to let the pod="minimi" by using service-account = pacman-rancher get the secret ="minimi" from my kv-service-crcr .
Decide which Kubernetes you want; RKE2 provided or AKS self-made
Make sure your Helm Chart 0.0.1 is ready and deploys on kind (and ideally also on a real cluster)
Systematize your ADRs and review them.
Can you already clean some stuff up? Throw something out?
Congratulations, you've successfully completed the CD lecture! You should have some opinion about different deployment strategies, what TCO means, patching vs templating and joined the discussion on vendor lock-in.
What's next?
- OCI and Registry next week